Thursday, September 29, 2022

Money matters RBI has a grip on inflation


Money matters RBI has a grip on inflation 


Unlike other nations, RBI did not expand money supply rapidly; it can afford to go slow on tightening

At the beginning of the pandemic, when many Western countries began with unprecedented fiscal stimuli, a few economists had warned about the inflationary consequences of such spending. About two-and-a-half years later, these prophecies seem to have come true — most countries are experiencing historically high inflation levels.

Jerome Powell, Chairman of the Board of Governors, Federal Reserve System, in his recent Jackson Hole Economic Policy Symposium 2022 speech, warned that households and businesses must be prepared to endure more pain to bring inflation under control.

In this context, we evaluate India’s performance on the inflation front with the rest of the world. The spike in inflation in India appears to be driven primarily due to the supply shock of the Ukraine war. Therefore, contrary to the critics of the RBI being “behind the curve” in monetary tightening, the RBI’s policies seem to have been appropriate.

Using IMF data on money supply and inflation we restrict the analysis to G-20 countries with available inflation and money supply data to maintain comparability. Our first test relates to the change in money supply in 2020 to the change in inflation in 2021. Note that most of the expansionary policy responses to the shock were implemented in 2020. And inflation usually manifests with a lag after monetary expansion. These two facts motivate the choice of our sample period.

Global experience

Figure 1 depicts our findings. We show the percentage change in the broad measure of money supply known as M3 (it includes currency, demand, and time deposits) on the horizontal axis. The percentage change in money supply is for 2020 compared to 2019. The change in inflation in terms of percentage points on the vertical axis. The change in inflation is the difference in average inflation rates between 2021 and 2020. It is crucial to note that we measure the change in inflation at the end of December 2021, before the Russia-Ukraine war. Thus, the war impacts our analysis only to the extent that the expectations of war influenced commodity prices before December 2021.

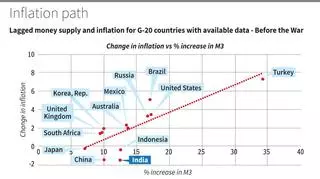
There is a clear pattern in the data. Countries that expanded money supply more rapidly in 2020 experienced higher inflation in 2021. The right extreme is Turkey, which expanded the money supply by 34.24 per cent and experienced a 7.3 percentage points increase in inflation.

The US also shows a similar pattern: a 17.19 per cent increase in money supply in 2020, followed by a 3.46 percentage points increase in inflation. Inflation in the US nearly tripled much before the war. While Turkey appears to be an outlier, the relationship between the increase in money supply and change in inflation remains visually similar, even excluding Turkey.

India’s path

How does India fare in this analysis? India lies significantly below the trend line and relatively closer to the origin in the horizontal axis. India’s money supply grew by 12.47 per cent, and inflation declined by 1.49 percentage points. On a relative basis, both the growth in money supply and the change in inflation in India were lower than the global average and the median.

In other words, India did not expand its money supply disproportionately during the crisis and did not experience an inflation shock in 2021. Of course, some would argue that India should have, instead, expanded its money supply by giving cash transfers to the poor and borne the inflation consequences today.

First, the same people would, most probably, be blaming the government for even higher inflation today. And second, even from a welfarist perspective, this view does not pass muster, given the Centre’s policy of free rations to the poor for two years and counting. We believe that India’s relatively better performance on inflation, despite increasing its money supply, could be because it used the Covid crisis for financing capex and utilised its PDS grain stock as insurance for the poor.

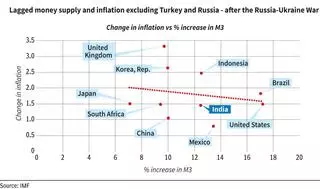
We next focus on the situation after the war broke out. As before, we compare the association between the additional money pumped and the incremental inflation. The inflation we consider in the second analysis is the change in the inflation rate between December 2021 and June 2022. We exclude Russia due to the extraordinary circumstance the country faced after the declaration of war. We also exclude Turkey as it continued to expand money at an extraordinary pace even after the Covid shock receded.

Supply shocks

There doesn’t seem to be any significant association between the increase in money supply during 2020 and inflation after the war. Also, even in the post-war period, India lies below the trend line. More importantly, a significant part of India’s recent inflation increase happened during this phase. Therefore, the inflation in this phase seems to be driven more by a supply shock rather than lower unemployment caused by increased money supply.

Given our analysis’ preliminary and summary nature, one needs to be careful before drawing strong conclusions. Given the evidence, it is possible to dismiss the view that the RBI is behind the curve in tightening. Since the RBI did not expand the money supply as rapidly as other countries, it is justified in not tightening rapidly.

Two important caveats are in order here. First, we cannot precisely disentangle the demand and supply side impacts. Second, the analysis is based on the monetarist tool of money supply and not the neo-Keynesian tool of nominal rates.

We recognise that it is hard to measure the money supply in an economy precisely. Our choice is dictated by ease of comparison and availability of data.

Saturday, September 24, 2022

Third Interest Rate Hike by US Federal Bank

 In a third straight increase in interest rate, the US Federal Reserve on Wednesday hiked policy interest rate by 75 basis points. It has signalled more large increases in the months to come. Know how the rate hike will impact Indian Economy

USA INFLATION 2022 AUGUST

 The annual inflation rate for the United States is 8.3% for the 12 months ended August 2022 after rising 8.5% previously, according to U.S. Labor Department data published Sept. 13. The next inflation update is scheduled for release on Oct. 13 at 8:30 a.m. ET. It will offer the rate of inflation over the 12 months ended September 2022.

Thursday, September 15, 2022

In the next 5-10 yrs, big to get bigger but small to emerge as leaders of tomorrow: Hiren Ved

 “I do not think the market is pricing in a long-term structural earnings growth story. When I read a lot of strategy reports and earnings reports and people are still going “oh we are cutting.” Sour grapes absolutely,” Hiren Ved, Director & CIO, Alchemy Capital Management


ADVERTISEMENT
Markets are trading way above their long-term averages and if you bought at these long-term averages, you are not going to make money?
I disagree. What I have learnt is that you need to first understand the circumstances and decide whether the market should trade below averages or above averages. It does not trade at average and average is just a statistical number. In my view, when I put together how India is placed today versus the world, how we are starting a new earnings growth cycle in this country, how broad based the growth is beginning to happen, how manufacturing is reviving in this country -- it looks like we should trade above average. So, there is no case for trading at average and that is point number one.
Point number two is that most analysts, sell side houses, brokerages get caught up in near term numbers. In Q1, we had a strong top line growth because of inflation and everybody took price hikes but there was a 450 bps knock on EBITDA margins if one takes financials out on a year on year basis.

my watchlist my news widgetQoQ, if my memory serves right, there was about 280 bps of EBITDA margin shrinkage. Now all the raw material price hikes have not gone through. People take price hikes slowly and steadily plus one may have some high cost raw material sitting in the inventory which will impact for a quarter or two.
My view is that even if half of what you have lost in EBITDA margins comes back to you in the second half, people will start upgrading earnings. The 2024 Nifty earnings were about 1,000 plus. They have now been cut to 960. I would not be surprised if six months down the line, this number goes back above 1,000.
And we are talking about FY23 and not about FY24?
I am not even going to FY24. I think some of that will come back in the second half of FY23 and some of that will come back next year because we will have a high base of higher raw material cost this year. Next year, we will have a favourable base in FY24. My point is that people look from quarter to quarter. Based on Q1 EBITDA margins, has any analyst today baked in a higher EBITDA margins in FY24? No, they will not do it, they will wait for the margins to improve and then slowly will take the margins up by which time the markets would have already figured it out.

So it is QSQT or Quarter Se Quarter Tak in markets?
Yes and I do not blame them because that is how they are structured to look at things. As investors, we are told to look at the big picture, we are told to step back a little bit and not get too flustered about what is happening from quarter to quarter and look at the big picture. To me the big picture and the future looks very bright for India.
It is said that history may not repeat itself but it certainly rhymes. What has happened in the past will certainly happen in the future; courses remain the same, the horses change. Where are we in terms of this bull market cycle? Is it still alive and kicking? If this bull market is a train journey from Churchgate to Borivali, where has this bull market reached?
We are still at Marine Lines.

Still at Marine Lines? You mean this bull market still has a long long long way to go? Why do you feel that?
There are a couple of structural factors. The economy has taken a lot of pain in the last few years – whether it was the disruption because of demonetisation, whether it was the adjustment because of GST. Then we almost had credit markets freeze in India post IL&FS in the past 18 months.
It may not matter to the top 30, 40, 50 companies but it matters to the breadth of the economy – small, medium enterprises and small companies. When you squeeze liquidity out of the system, it matters when credit markets become so tough. Then there was Covid. If you have survived till today as a business, then I think you have built a lot of immunity because you have taken so much pressure and survived and now they are ready to run.

Secondly the credit cycle in India is just starting; bank balance sheets are clean, credit growth can happen and that is still ahead of us. Manufacturing went into a 10-year slumber in this country and that is waking up. One may call it PLI, you may call it China plus one, one may call it Europe plus one – whatever – and we are seeing iPhone being made in India and now Google says they are going to make Pixel in India. We are going to see a manufacturing renaissance in this country for the next 10 years.

Like what we saw in IT it is going to happen in manufacturing?
Exactly! We are now getting very serious about defence manufacturing, we are getting serious about semi-conductor manufacturing. We are getting serious about all kinds of manufacturing in this country, specialty chemicals, APIs, drugs, pharmaceuticals. What is going to change in my view is that 2018, 2019, 2020, 2021 was all about betting on the big and the strong and betting on consolidation.
If you bought into an HDFC Bank or a Kotak Bank you made money. If you bought into Infosys ahead of midcap IT, you made money. If you bought an HUL ahead of let us say…
Yes generally. Generally speaking, the theme has been that the big are getting bigger, the strong are getting stronger, the organised are taking market share away from the unorganised and that trend definitely has been there and investors have played that trend.

In the next five, seven, ten years, the big will continue to get bigger but there is a second trend which is starting which is the survivors; the smaller companies, the manufacturing companies are likely to now grow and spread. Look at the price action of the market; the breadth of the market has improved and that is telling us why small and midcaps are outperforming the large caps. That story is well and truly discovered, betting on the leaders of yesterday and today, the time has come to bet on the leaders of tomorrow.


But we are in a tough macro environment. We are going to have QT or quantitative tightening. Inflation is back and here to stay. Liquidity will be less whether it is because of RBI or because of global factors. Historically, in a tightening liquidity environment, small and midcap stocks fare poorly.
You are right but what is different this time is that the corporate sector is deleveraged. QT or sucking away liquidity really plays in two ways – one is that availability of credit to the wider sector becomes a problem and secondly, it also dampens demand and sentiment to some extent.

Now I am not sure whether what we think of as QT will run its full course. It never has. It did not even after the 2008-09 crisis. They pulled back liquidity a little bit and then they stopped. Pretty much the same thing is going to happen. We talk about QT. What has the UK done? They have capped energy prices. That to me is QE because that is a 150 billion pound stimulus.

If today somebody was to tell me I am going to cap your electricity bill at Rs 2,000 or Rs 5,000, what does it mean? It means QE to me because I would not have to pay for energy prices and I will save that money and I will spend that money somewhere else. So the structure of the world is such that every time there is a crisis in some form or the other, the government either does a fiscal transfer or a monetary easing.

Now because inflation is at our back, one cannot do monetary easing but once inflation peaks and growth slows, I do not think QT will happen.

My view is that higher rates in India unless they go abnormally high are not going to matter either to demand or to the corporate sector because the corporate sector is already deleveraged. We are not leveraged any more. We were leveraged five, seven, ten years ago when the NPL problem was at its peak. We were coming off a massive leverage cycle from 2006-07 right up to 2010-11 and then we have ten years of deleveraging.

I do not think QT is really going to matter. I think balance sheets are strong, cash flows are strong. Look at the data. The top 500 companies in this country have generated Rs 1,85,000 crore of free cash flow during the two years of Covid.

The Tata Group has projected to have cash flow of nearly Rs 2 lakh crore in FY23 which is an outstanding number.
And the second thing is that today if you have a reasonable business idea there is enough capital to back it, which was not the case earlier. We now have a very well developed startup ecosystem, venture capital, private equity, there is so much money waiting on the sidelines to be poured in. Now even in the new age stocks, valuation corrections have happened and so I think the cycles will play for itself. I just feel that we are going to have a big growth cycle in this country, we are so sweetly poised. Yes the only risk is that we tend to believe this is too early so I hope we do not make some mistakes…

And the market, according to you, is not pricing in this scenario?
No, I do not think so. I do not think the market is pricing in a long-term structural earnings growth story. When I read a lot of strategy reports and earnings reports and people are still going “oh we are cutting.” It is sour grapes absolutely

Tuesday, September 13, 2022

U.S. consumer price index (CPI) inflation rose by 8.3% annually in August

 U.S. consumer price index (CPI) inflation rose by 0.1% for the month and 8.3% annually in August, the Bureau of Labor Statistics reported Tuesday, defying economist expectations that headline inflation would fall 0.1% month-on-month. Core CPI, which excludes volatile food and energy costs, climbed 0.6% from July and 6.3% from August 2021.

The reading fueled further bets from the market that the U.S. Federal Reserve will remain aggressive in its tightening of monetary policy.

Monday, September 12, 2022

RBI on brink of failure as retail inflation rises back to 7% in August


RBI on brink of failure as retail inflation rises back to 7% in August

India's headline retail inflation rate, as measured by the Consumer Price Index (CPI), returned to 7 percent territory in August according to data released on September 12 by the Ministry of Statistics and Programme Implementation.

CPI inflation had fallen to 6.71 percent in July after spending three consecutive months above 7 percent.

At 7 percent, the August CPI inflation figure is slightly above the consensus estimate. CPI inflation was seen rising to 6.9 percent.

Having averaged 6.3 percent in January-March and 7.3 percent in April-June, inflation must fall to at least 4.1 percent in September for the July-September average to come in under 6 percent and the RBI to avoid failure - an unlikely scenario.


Bank credit growth hits near nine-year high of 15.5%, shows RBI data


Bank credit growth hits near nine-year high of 15.5%, shows RBI data

Credit growth of commercial banks is at a near nine-year high of 15.5 per cent year-on-year for the week ended August 26, latest data released by the Reserve Bank of India showed. The credit growth is the highest since November 1, 2013, when it was 16.1 per cent.

In the current financial year so far, banks have extended Rs 5.66 trillion by way of loans, representing a growth of 4.8 per cent as compared to -0.5 per cent during the same period last year.

Credit growth in the system is quite robust currently and at a multi-year high but touching 20 per cent growth looks challenging given that most of the heavy lifting is being done by the retail segment,” Prakash Agarwal, director and head–financial institutions, India Ratings

For credit growth to touch 20 per cent, the pace of economic growth to be much higher entailed larger credit expansion on the industrial side as well as supporting deposit accretion. Credit growth should sustain at these levels for some time, especially with the festive season around,” he said, adding there could be some impact on loan demand going forward due to inflation and interest rate hikes.

Deposit growth was 9.5 per cent YoY, according to the data. Deposit growth has been trailing credit growth in this financial year, exacerbating concerns among analysts that slow deposit growth could emerge as one of the biggest constraints for loan growth in the system.

“We have seen a steady and broad-based pick-up in system credit growth despite rising interest rates, which we view positively. However, a widening gap between deposit and credit growth, remains our primary concern as it could lead to supply-side constraints going ahead,” said Macquarie Research in a report.

Bank credit growth hits near nine-year high of 15.5%, shows RBI data

Credit growth has remained over 15 per cent for two consecutive fortnights now, indicating a more sustained pick up in demand. For the fortnight ended August 12, banking credit grew at 15.3 per cent and deposits grew at 8.84 per cent. The incremental credit-deposit ratio is at 107.13 per cent as of August 26.

“The concerning issue here is the widening credit – deposit growth gap which is multi year high. Banks need to plan as this may turn out to be a constraining factor. They would have to raise their deposit rates further to attract more deposits, which may lead to a rise in the MCLR in the system,” Agarwal said.

RBI’s latest sectoral deployment of credit for July 2022 pointed out that not only is the retail segment seeing handsome growth of almost 19 per cent, supported by both secured and unsecured loans, credit to industry also saw the highest growth since 2014, due to increased demand for working capital in an inflationary environment. Also, Indian corporates have now turned towards banks for their funding requirements given bond yields have moved up sharply as compared to lending rates of banks.

Among industries, loans to micro and small industries grew by 28.3 per cent YoY; medium industries saw 36.8 YoY growth; and large industries saw 5.2 per cent growth. According to a report by ICICI Securities, sectoral lending to petroleum, iron and steel, petrochemicals, and mining were the key drivers of industry credit growth. On the other hand, telecommunications, textiles, food, processing, and other infrastructure offset the accretion partially.

Credit growth has seen sustained rise since April this year, despite the RBI adopting a tighter monetary policy stance. RBI’s six-member monetary policy committee has increased the benchmark repo rates by 140 basis points since May this year and consequently the bank’s have also increased their external benchmark linked loans by the same proportion. However, the MCLR hike has not been to that extent which is drawing the industries to borrow more from the banking sector.

According to RBI data, about 43.6 per cent loans of the banking system are linked to the external benchmark, which could be the repo rate, or yields on government securities such as 91-day and 182-day Treasury Bills. And, about 49.2 per cent of the banking system loans are linked to the MCLR.

Sunday, September 11, 2022

currency in circulation rose to ₹32,38,417 crore by June 10, 2022

 According to data with the Reserve Bank of India, currency in circulation rose to ₹32,38,417 crore by June 10, 2022, from ₹31,33,716 crore as on March 31, 2022. It was at ₹29,63,957 crore as on June 11, 2021.

Tuesday, September 6, 2022

currency in circulation rose to Rs 31.97 lakh crore for the week ended Aug. 19, 2022

 the currency in circulation rose to Rs 31.97 lakh crore for the week ended Aug. 19, 2022, according to RBI data. It rose by Rs 2.1 lakh crore between the start of the year to mid-August, compared to a rise of Rs 1.8 lakh crore in the same duration the previous year. Month-on-month, the currency in circulation on an average has fallen for the third straight month in August, as per data available


Bank credit grows 14.5% YoY as on July 29, deposits grow 9.1%: RBI data


Bank credit grows 14.5% YoY as on July 29, deposits grow 9.1%: RBI data

Bank credit rose 14.52% to Rs 123.69 trn and deposits increased 9.14% to Rs 169.72 trn in the fortnight ended July 29, according to RBI data

Ahead of festive season, credit offtake remains strong in July 2022

Reserve Bank of India (RBI) data showed that credit to industry grew 10.5 per cent in July 2022 against a mere 0.4 per cent in July 2021

Friday, September 2, 2022

Global bonds tumble into their first bear market in a generation

 Under pressure from central bankers determined to quash inflation even at the cost of a recession, global bonds slumped into their first bear market in a generation.

The Bloomberg Global Aggregate Total Return Index of government and investment-grade corporate bonds has fallen more than 20% below its 2021 peak, the biggest drawdown since its 1990 inception. Officials from the US to Europe have hammered home the importance of tighter monetary policy in recent days, building on the strong hawkish message from Federal Reserve Chair Jerome Powell at the recent Jackson Hole symposium.

814x-1 - 2022-09-02T072212.289Soaring inflation and the steep interest-rate hikes deployed by policy makers in response have brought to an end a four-decade bull market in bonds. That has created a particularly difficult environment for investors this year, with bonds and stocks sinking in tandem.“I suspect that the secular bull market in bonds that started in the mid-1980s is ending,” said Stephen Miller, who’s covered fixed income since then and now works as an investment consultant at GSFM, a unit of Canada’s CI Financial Corp. “Yields aren’t going to return to the historic lows seen both before and during the pandemic.”
The very high inflation the world now faces means central banks won’t be prepared to deploy the sort of extreme stimulus that helped send Treasury yields below 1%, he added.The simultaneous swoons for fixed-income and equity assets are undermining a mainstay of investing strategies over the past 40 years or more. Bloomberg’s bond gauge is down 16% in 2022, while MSCI Inc.’s index of global stocks has seen a larger decline.

That has pushed a US measure of the classic 60/40 portfolio -- where investments are split by those proportions between stocks and bonds -- down 15% so far this year, on track for its worst annual loss since 2008.
Back to the ’60s
In many ways the economic and policy realities now facing investors year hark back to the 1960s bear market for bonds, which began in the second half of that decade when a period of low inflation and unemployment came to a sudden end. As inflation accelerated through the 1970s, benchmark Treasury yields surged. They would later hit almost 16% in 1981 after then Fed Chair Paul Volcker had raised rates to 20% to tame price pressures.

Powell cited the 1980s to back his hawkish stance at Jackson Hole, saying “the historical record cautions strongly against prematurely loosening policy.” Swaps traders now see almost 70% odds that the Fed will deliver a third-straight hike of 75 basis points when it meets in just over three weeks.
Other central bankers at Jackson Hole, from Europe to South Korea and New Zealand, also indicated that rates will continue to rise at pace.

Still, fixed-income investors are showing plenty of demand for government bonds as yields rise, aided by lingering expectations that policy makers will need to reverse course should economic slowdowns help cool inflation. In the US, options markets are still pricing in more than one 25 basis point rate cut next year.

“I wouldn’t characterize the current trend as a new secular bond bear market but more of a necessary correction from a period of unsustainably ultra-low yields,” said Steven Oh, global head of credit and fixed income at PineBridge Investments LP. “Our expectations are that yields will remain low by long-term historical standards and 2022 is likely to represent the peak in 10-year bond yields in the current cycle.”