Personality of corrective waves
Well, as I did in the previous article, I will start with general characteristics of corrective waves on the example of a simple zigzag:
Top (the start of wave A). At large degrees, the end of the fifth wave is characterized by arrogance and high expectations for further growth. Many believe that prosperity and peace are guaranteed forever. At intermediate degrees, the majority of traders are also positive, counting on further economic improvement. At minor degrees, the end of the fifth wave is often accompanied by “good news”.
Technical breakdown (wave A). It is not a fundamental fall. It can be sometimes sharp, especially if the fifth wave featured dynamic price changes. At this time, experienced traders already consider entering long trades, and the weak holders hope for the continuation of the previous trend.
Narrow, emotional advance (wave B). It manifests the sentiment of the majority. It is usually technically weak and doesn’t last long. Besides, the majority has a sense of aggressive euphoria, not confirming that the trend has ended.
Worst of the bear market (wave C). It is characterized by strength and breadth. Prices decline relentlessly, and the majority, following the professional traders, become confident in the further price fall.
“A” waves
At the inception of wave A, the investment world is generally convinced that this price decline is just a short pullback. Like the first wave of an impulse, the structure of wave A results from the preceding processes. If the fifth wave features a sharp surge, the first corrective wave will demonstrate a sharp drawdown. But the majority of traders are still positive and see the drop as a response to the assets overvaluation that is though to be on the fifth wave.
Positive sentiment has its impact on the trading volume that accompanies wave A. High volume can sometimes be observed at the very beginning of the correction, or it sometimes can be absent. In the second part of wave A, due to the lack of traders’ confidence in the strength of the bear trend, the volume decreases which means that there is going to be a pullback.
Besides, the "A" wave sets the tone for the "B" wave to follow. A three-wave A indicates a horizontal or a flat for wave B, while a five-wave A indicates a zigzag.
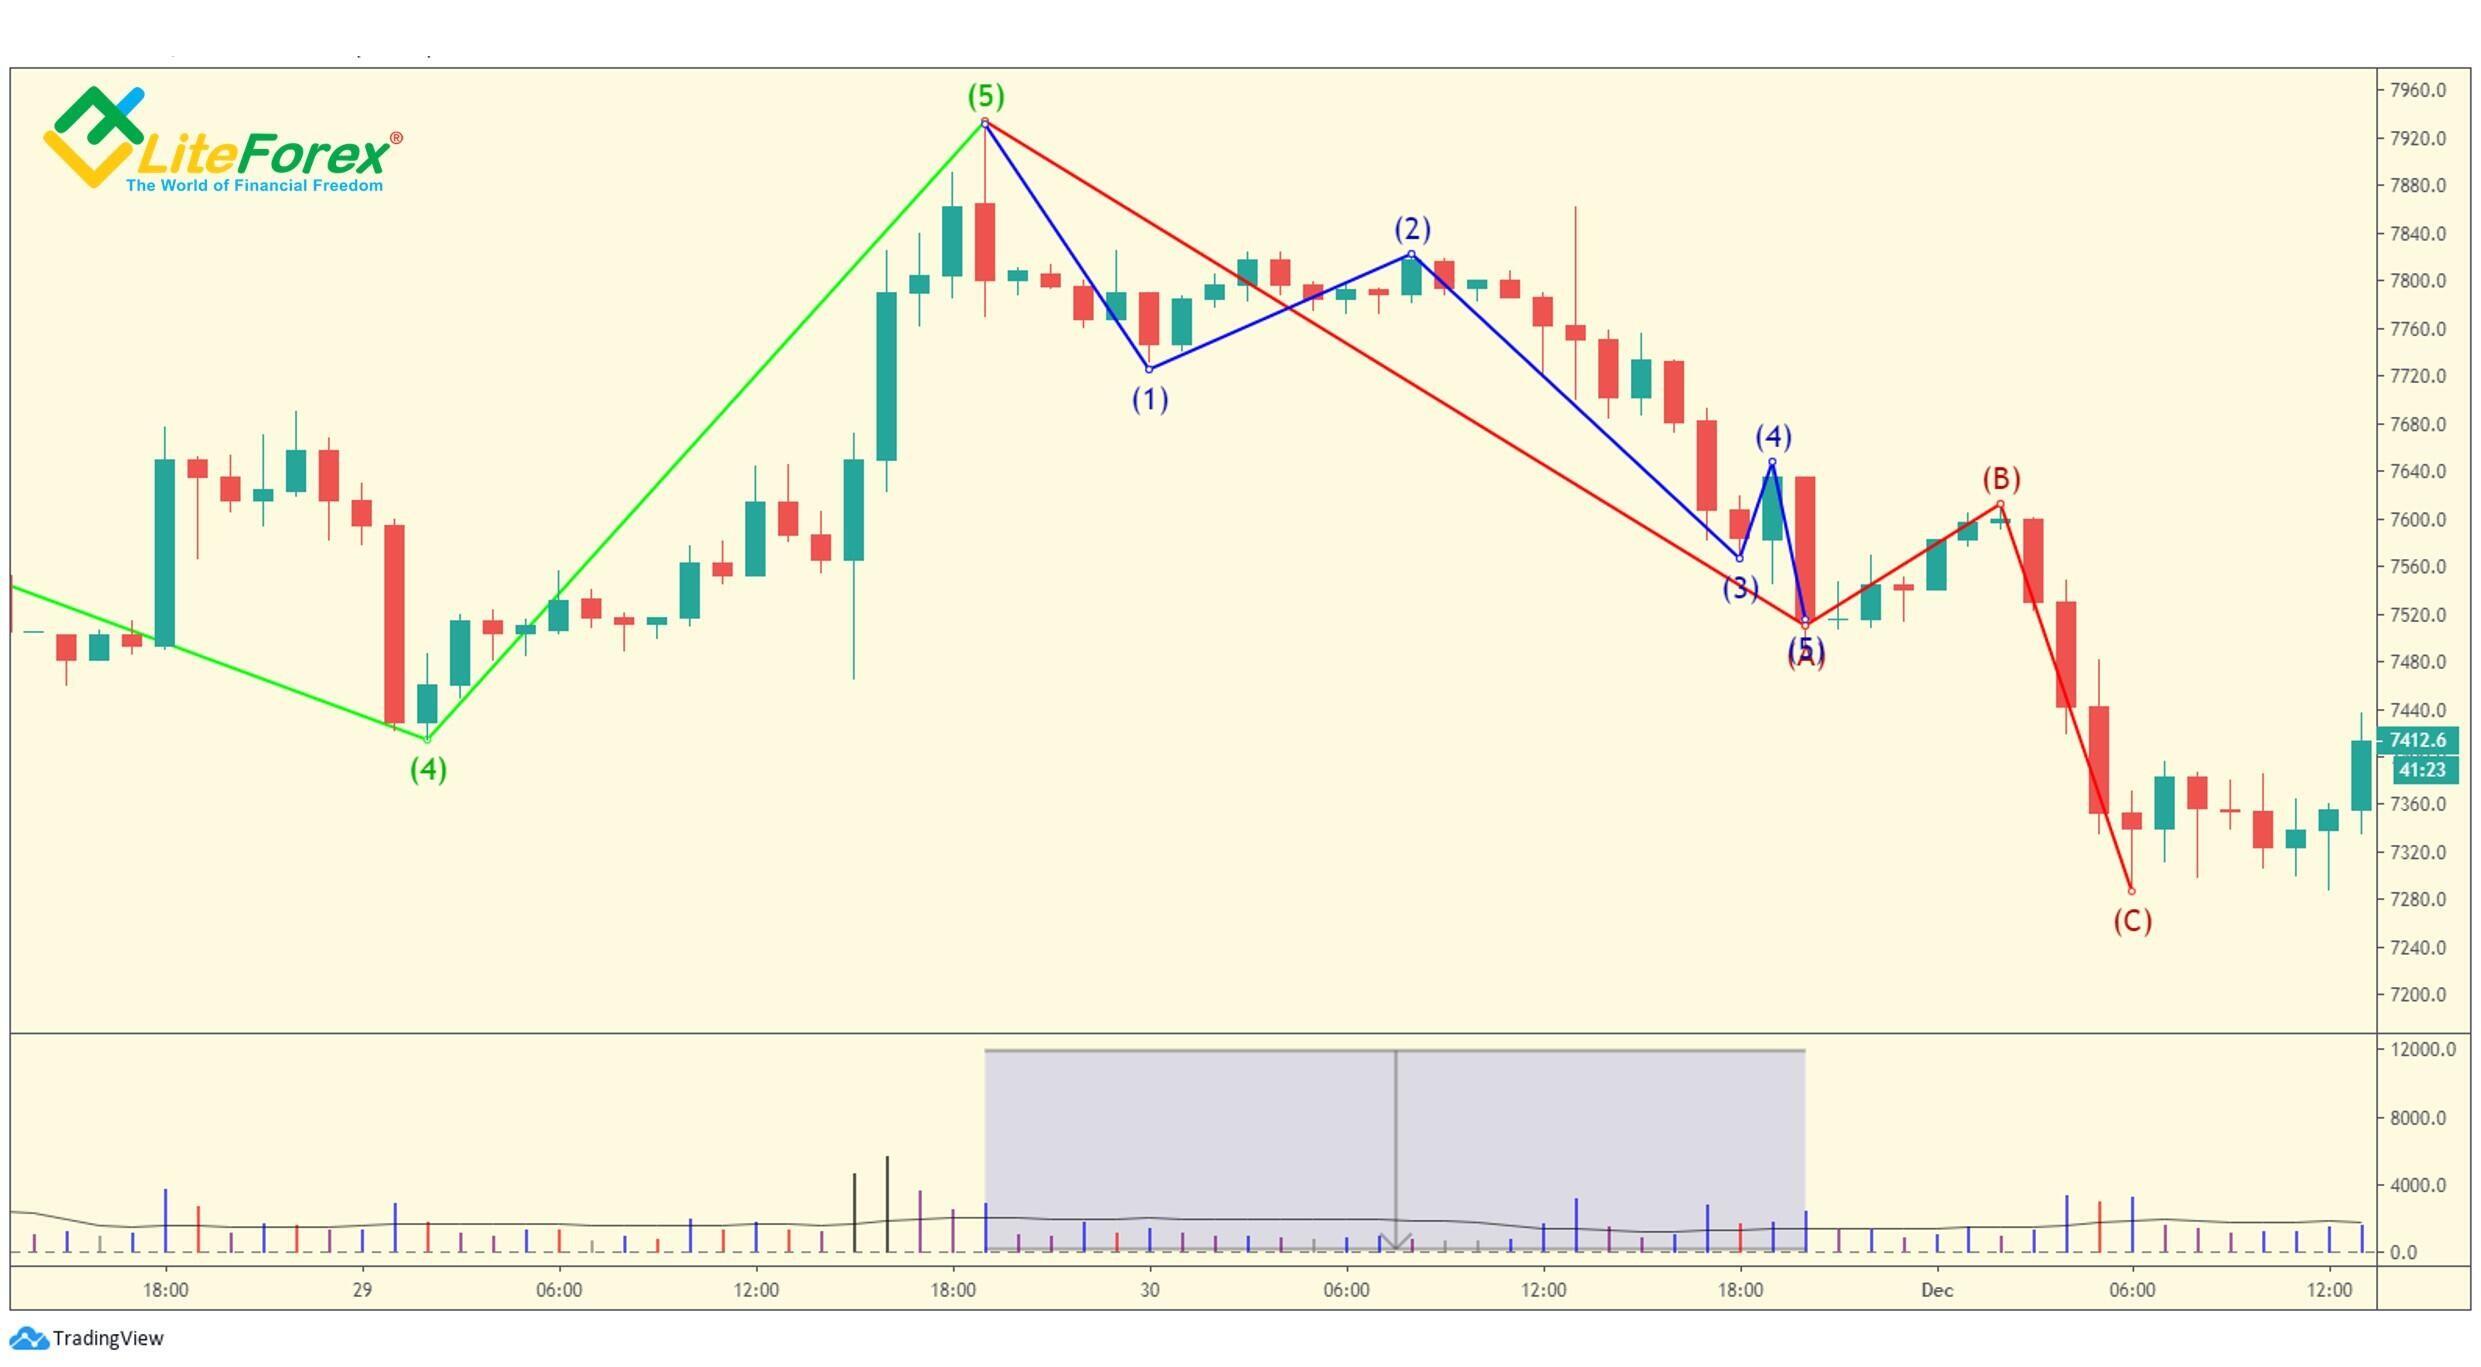
The hourly BTCUSD price chart above displays a three-wave correction, where the first wave is accompanied by low volume even at the sections where it is falling relatively fast (marked with the blue area). In addition, note the structure of the first wave. It consists of five sub-waves, so we can expect the B wave to unfold as a zigzag.
“B” waves
Robert Prechter says the “B” waves are phonies. They are often used as traps by experienced traders and speculators. At the end of the A wave, some traders cease to believe in the continuation of the old impulse and already start considering long positions. However, as the B wave starts, they again have some hope, even though it is rarely technically strong. It is an excellent opportunity to make a profit for large traders.
By its personality, the B wave rarely features dynamic price changes. Moreover, they rarely reach the top of the last impulse wave, though it could occur as you remember from previous lessons, for example, in the case of an expanded flat.
In general, "B" waves of Intermediate degree and lower usually show a lower volume than that which accompanied the preceding bull market. "B" waves of Primary degree and greater can display an increase in volume. In the first case, the relatively short duration of the correction doesn’t allow traders to believe in the strength of the uptrend so much that they would actively enter long trades. In the second case, everything is vice versa. The long bull movement attracts weak holders making them enter new trades.
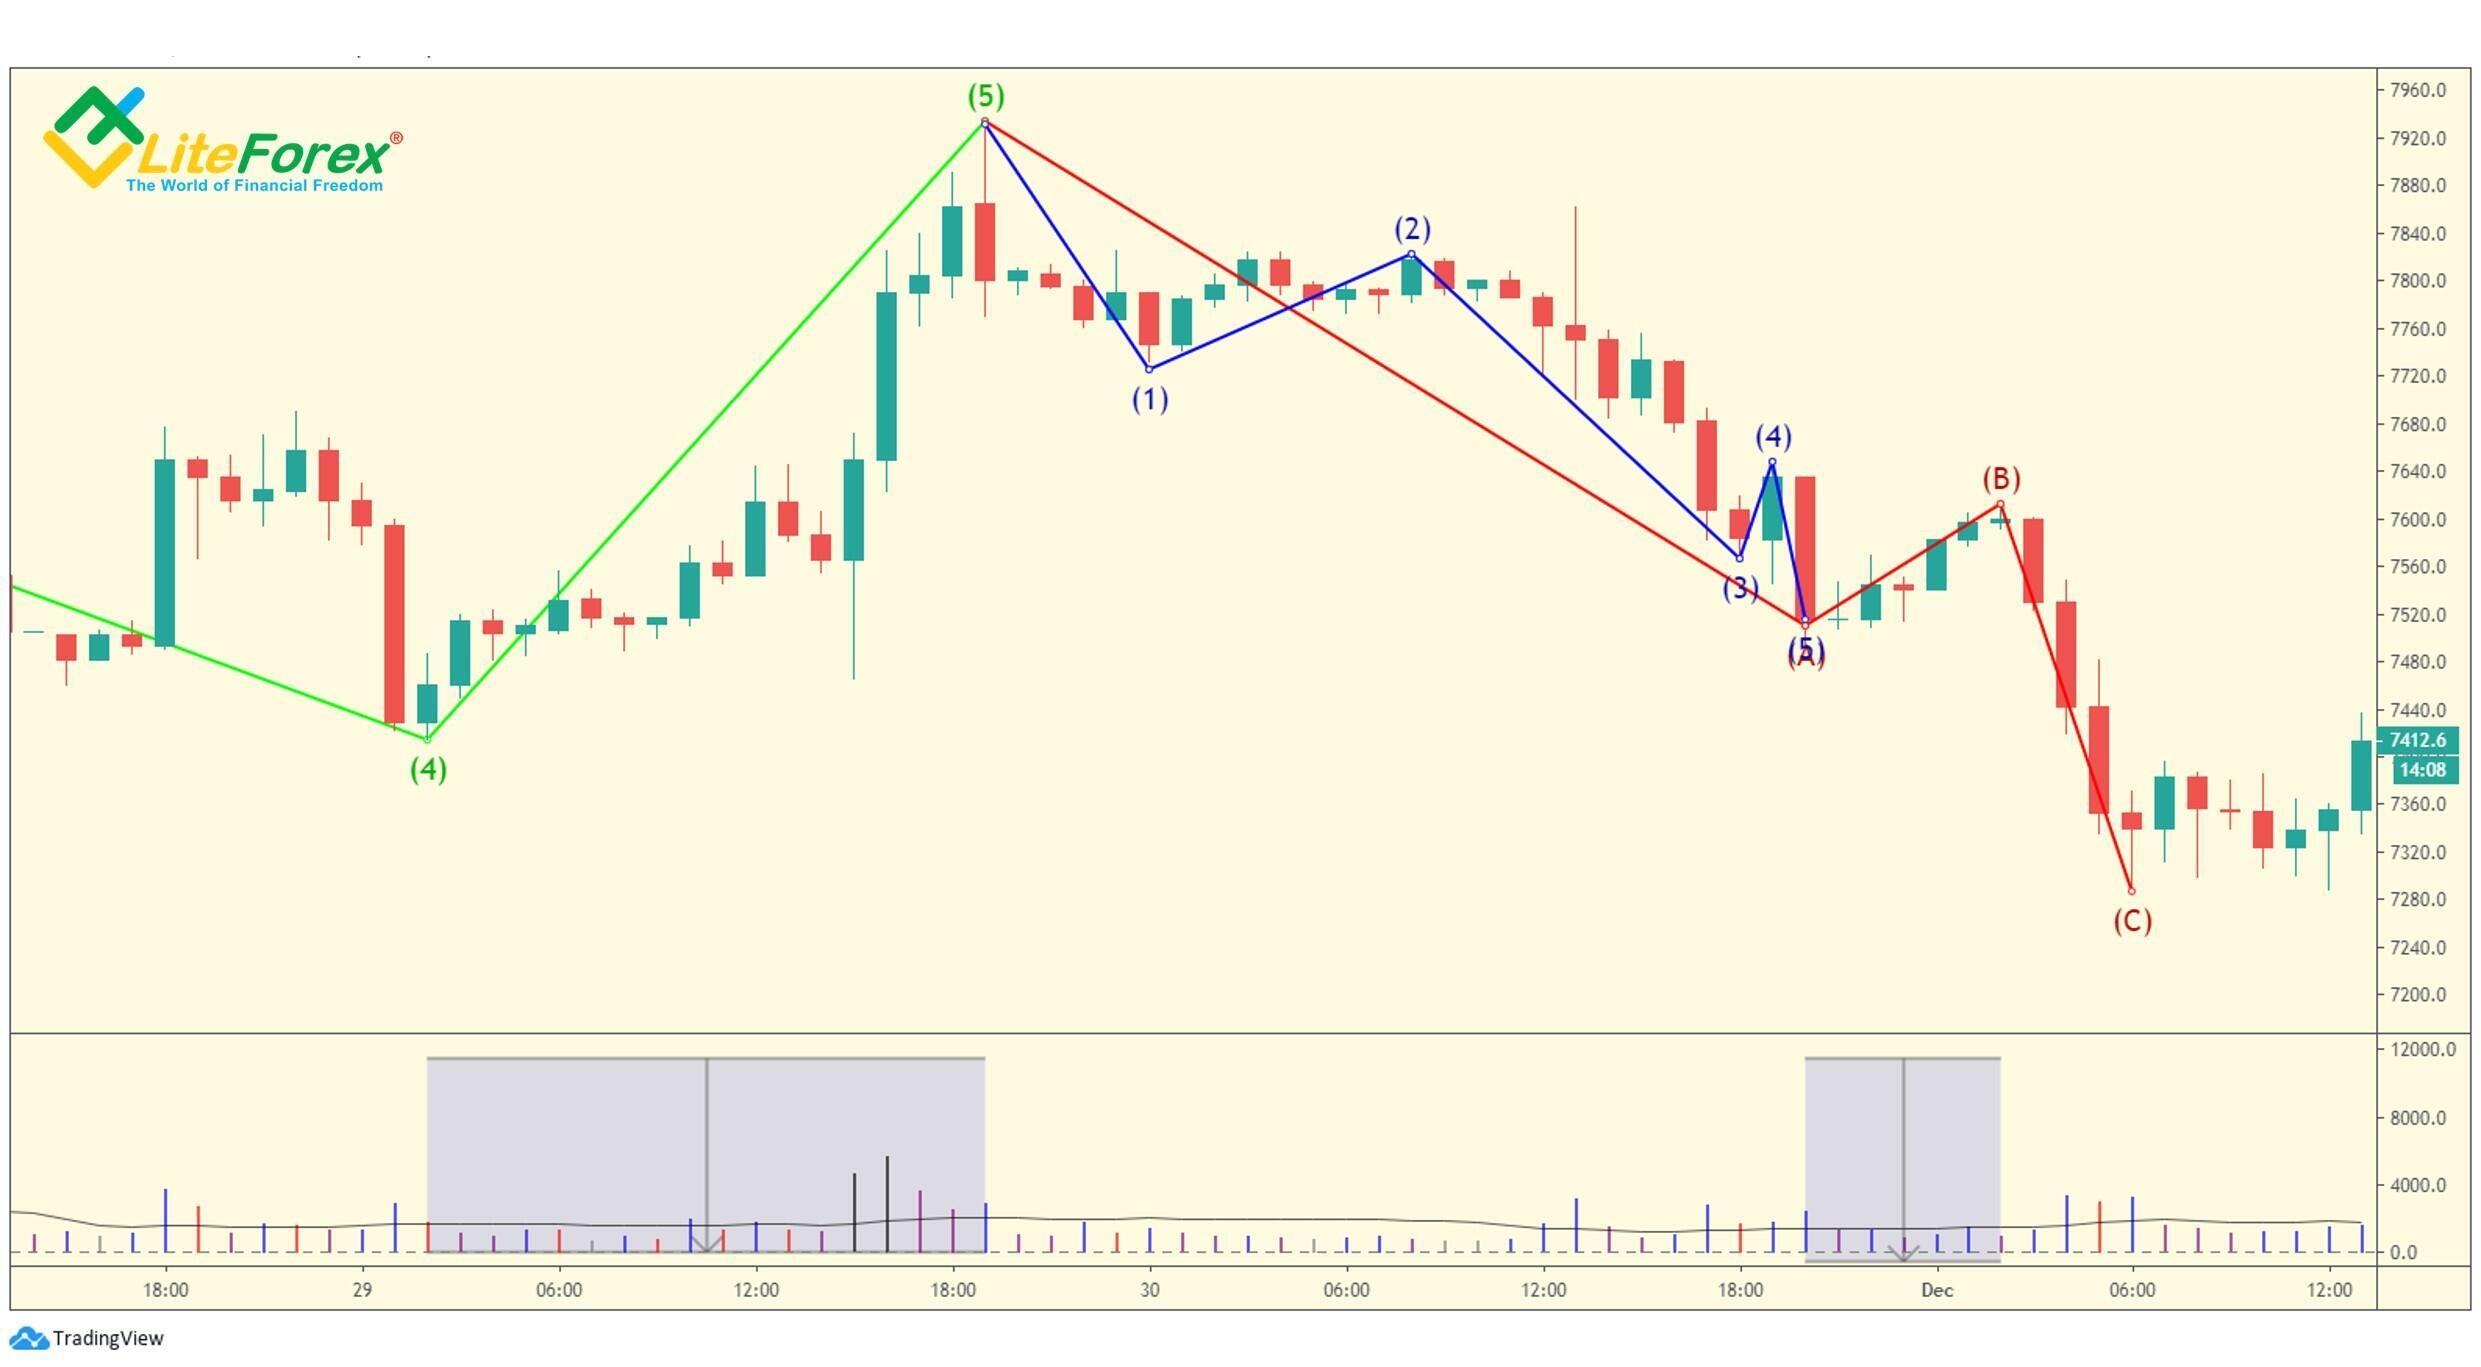
Blue areas in the BTCUSD mark in the chart the volume values that correspond to wave 5 of the primary impulse and to wave B of the correction. As you see, the second wave in the correction is accompanied by low volume and not very dynamic up movement. Besides, the originally low volume at the fifth wave increases by the end of the wave, at the B wave, however, this doesn’t happen even if the price movement is active. Moreover, note that the volume is low at the end of the wave, which indicates the trend weakness, and so, a soon reversal.
“C” waves
The C waves usually destruct traders’ hopes for the extension of the up movement. The fear and panic replace the previous positive expectations that were supported during the formation of wave B. Therefore, the structure of wave C may feature some uncertainty.
The C waves are third waves in a correction and so, they have most of the properties of third waves. They often feature great length and a strong drop. Unstable market sentiment, along with long duration, may be the reason for insignificant corrections, So, you must extremely careful analyzing them. Upward corrections in complex formations may sometimes be confused with the beginning of a new uptrend due to their five-wave structure.
C waves may be accompanied by different values of trade volume. If there is an active struggle, the volume can swing between high values and low. When there is a dynamic down movement, the volume usually rises at the moments of the greatest strength of the price movement.

Blue areas mark the values of volume corresponding to waves A and C. As the bearish movement is the most intensive on the third wave, the volume is a little higher than that accompanied wave A.
“D” waves
D waves, as you remember from previous training articles, are constituents of more complex formations. This property is that in all triangles, but for non-expanding triangles are often accompanied by increased volume. This property is explained by the fact that D waves in non-expanding triangles are hybrids, part corrective. However, having some characteristics of first waves since they follow C waves and are not fully retracted.
The D waves are basically as phony as the B waves. At the moment when almost all traders do not believe in a soon reversal up, it eventually occurs. This makes some of them enter long trades, which is used by professional speculators, who sell their assets at the best prices.
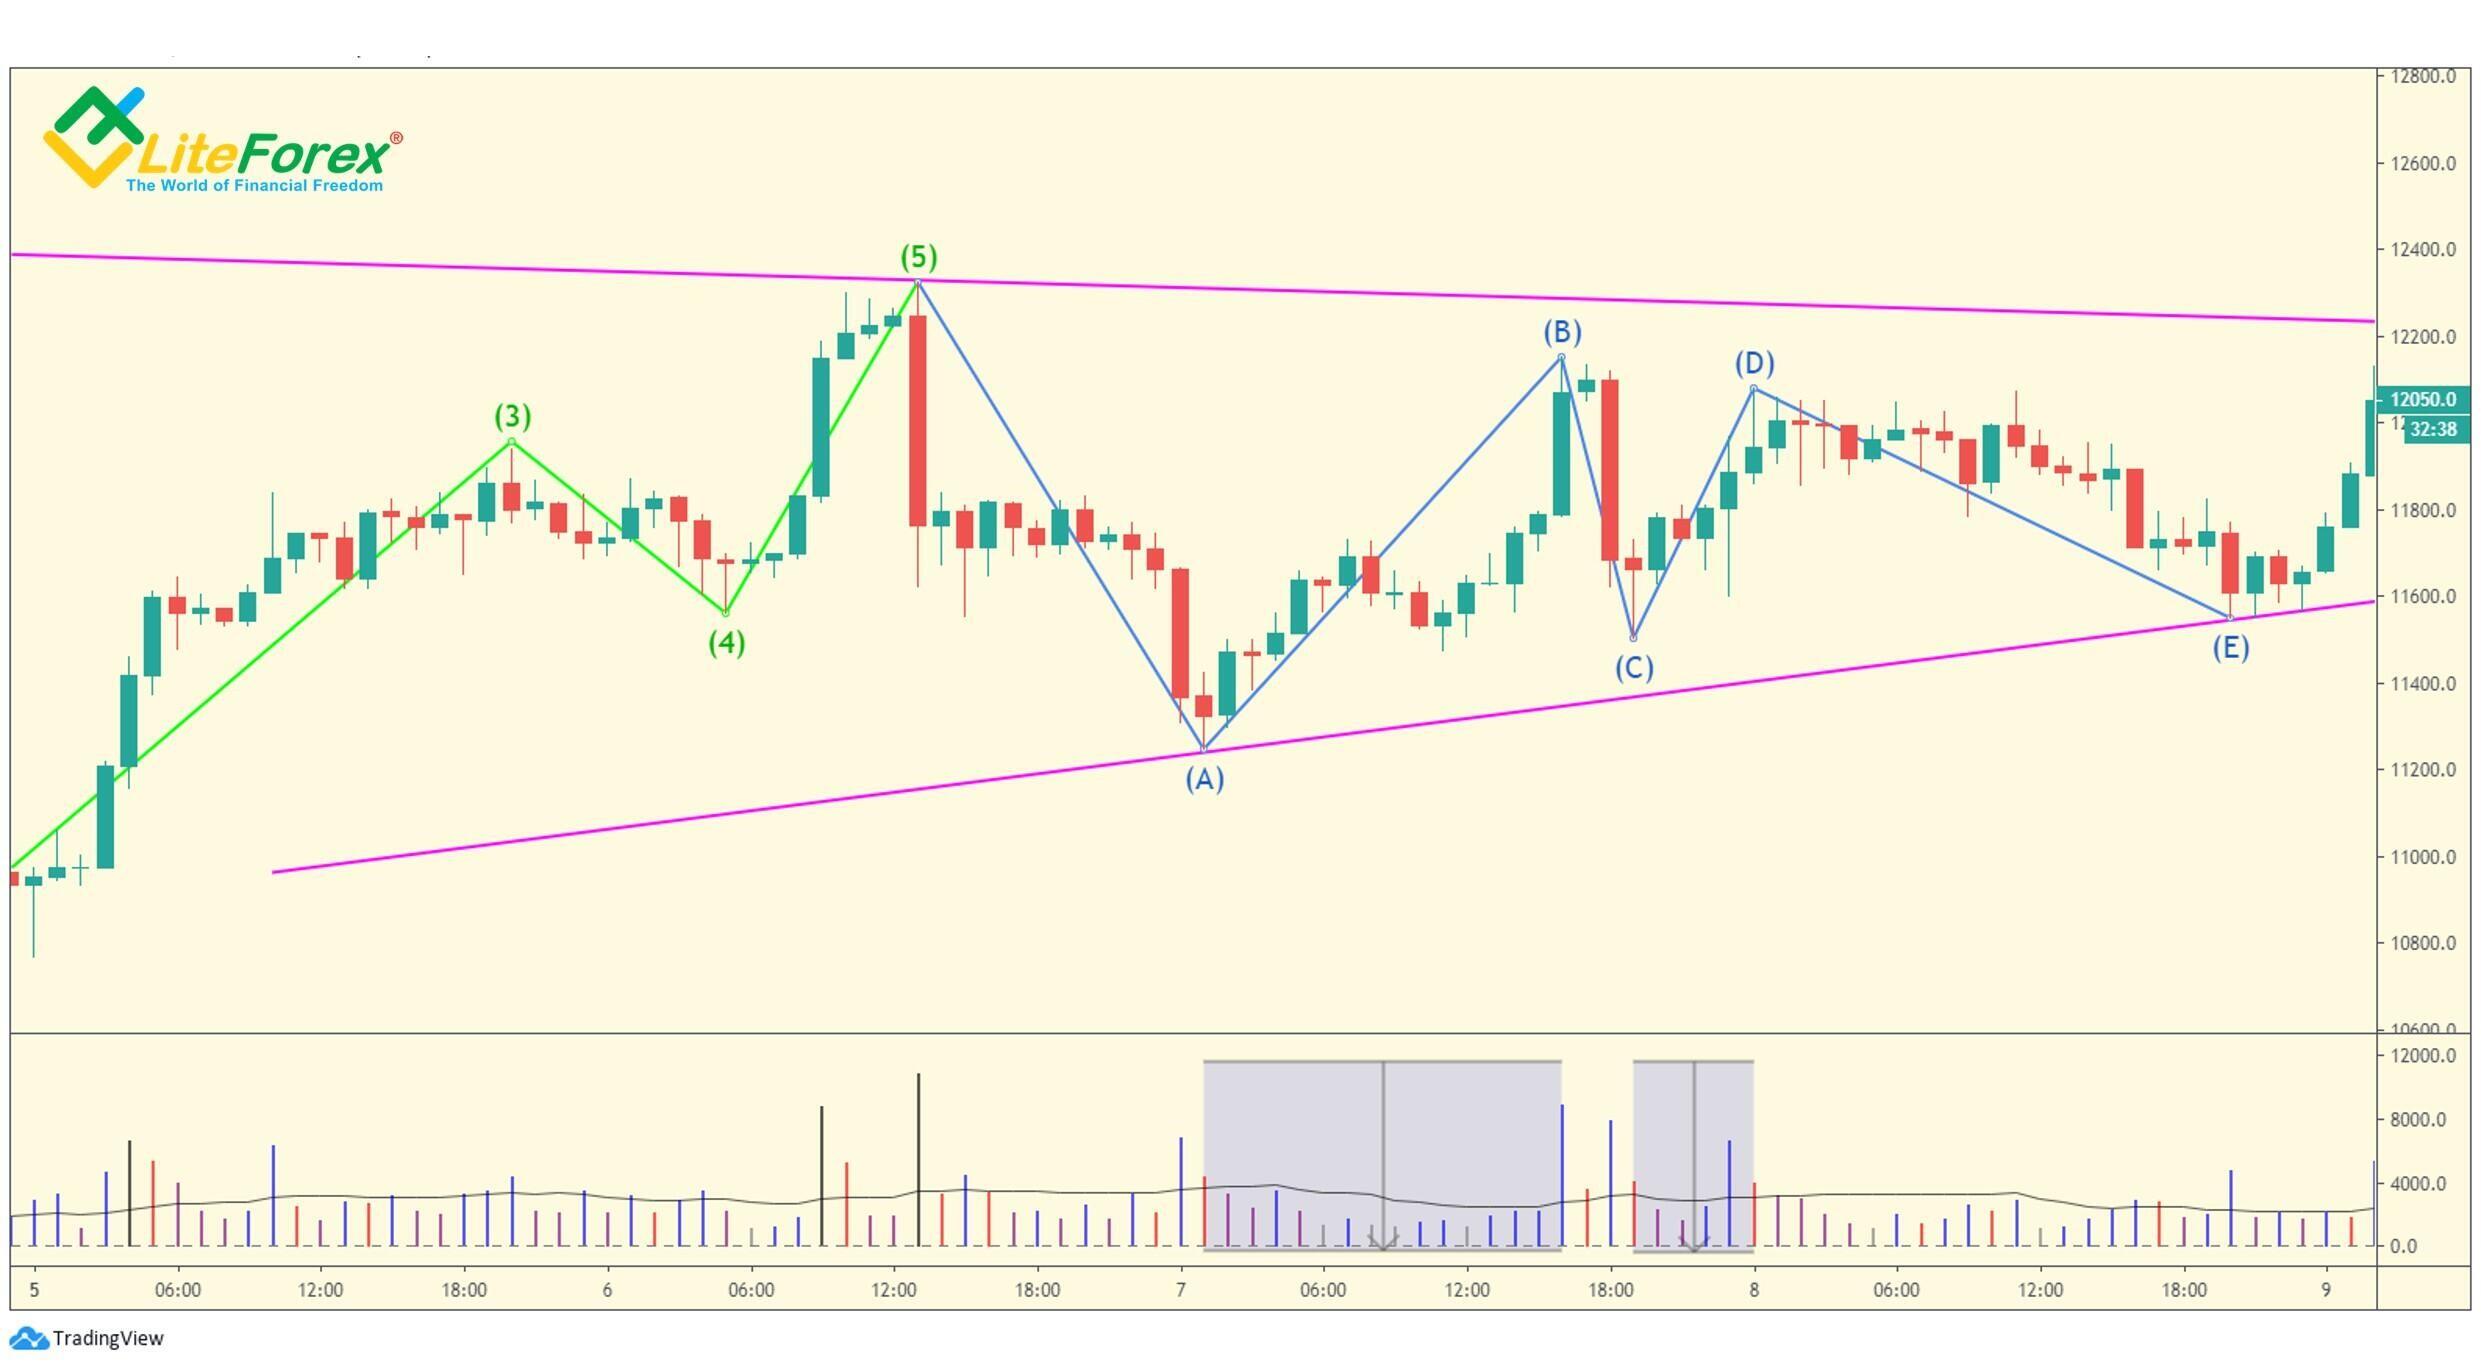
Blue areas mark in the chart the values of volume corresponding to waves B and D. As you see, the volume substantially increases with the developing of wave D. This is explained by the fact that weak holders enter trades being originally encouraged by the rise with the B wave; this is followed by a slight pullback with the C wave that could be well seen as a correction. Finally, the up move in the fourth wave of the triangle encouraged traders to enter long positions, which increased the volume.
“E” Waves
The E waves appear to most traders as a surprise. Besides the E waves commonly accompanied by “bad news”. The E wave intensifies the bearish conviction of market participants at precisely the time that they should be preparing for going long, so the E wave is used by market makers as a tarp for bears. Observing negative news and the market moving down, many traders enter shorts when the bear trend is already exhausting. In some cases, the bear sentiment is supported by the tendency of the wave to initiate a false breakdown through the triangle boundary line.
Thus, "E" waves, being ending waves resemble the fifth waves in terms of the psychological behavior of the market participants. This also applies to the increase in volume. At the Primary degree, when the down move goes on for quite a long time, the market forms a steady bear sentiment. As a result, many open short positions which trigger an increase in trade volume.
At smaller degrees, the E wave is less significant than the third corrective wave. Besides, in both cases, the volume increases substantially at the wave’s final stage. This is because, as the chart is tending to break through the triangle boundary line, many uninformed traders get deeper into the illusion of a strong bear trend.
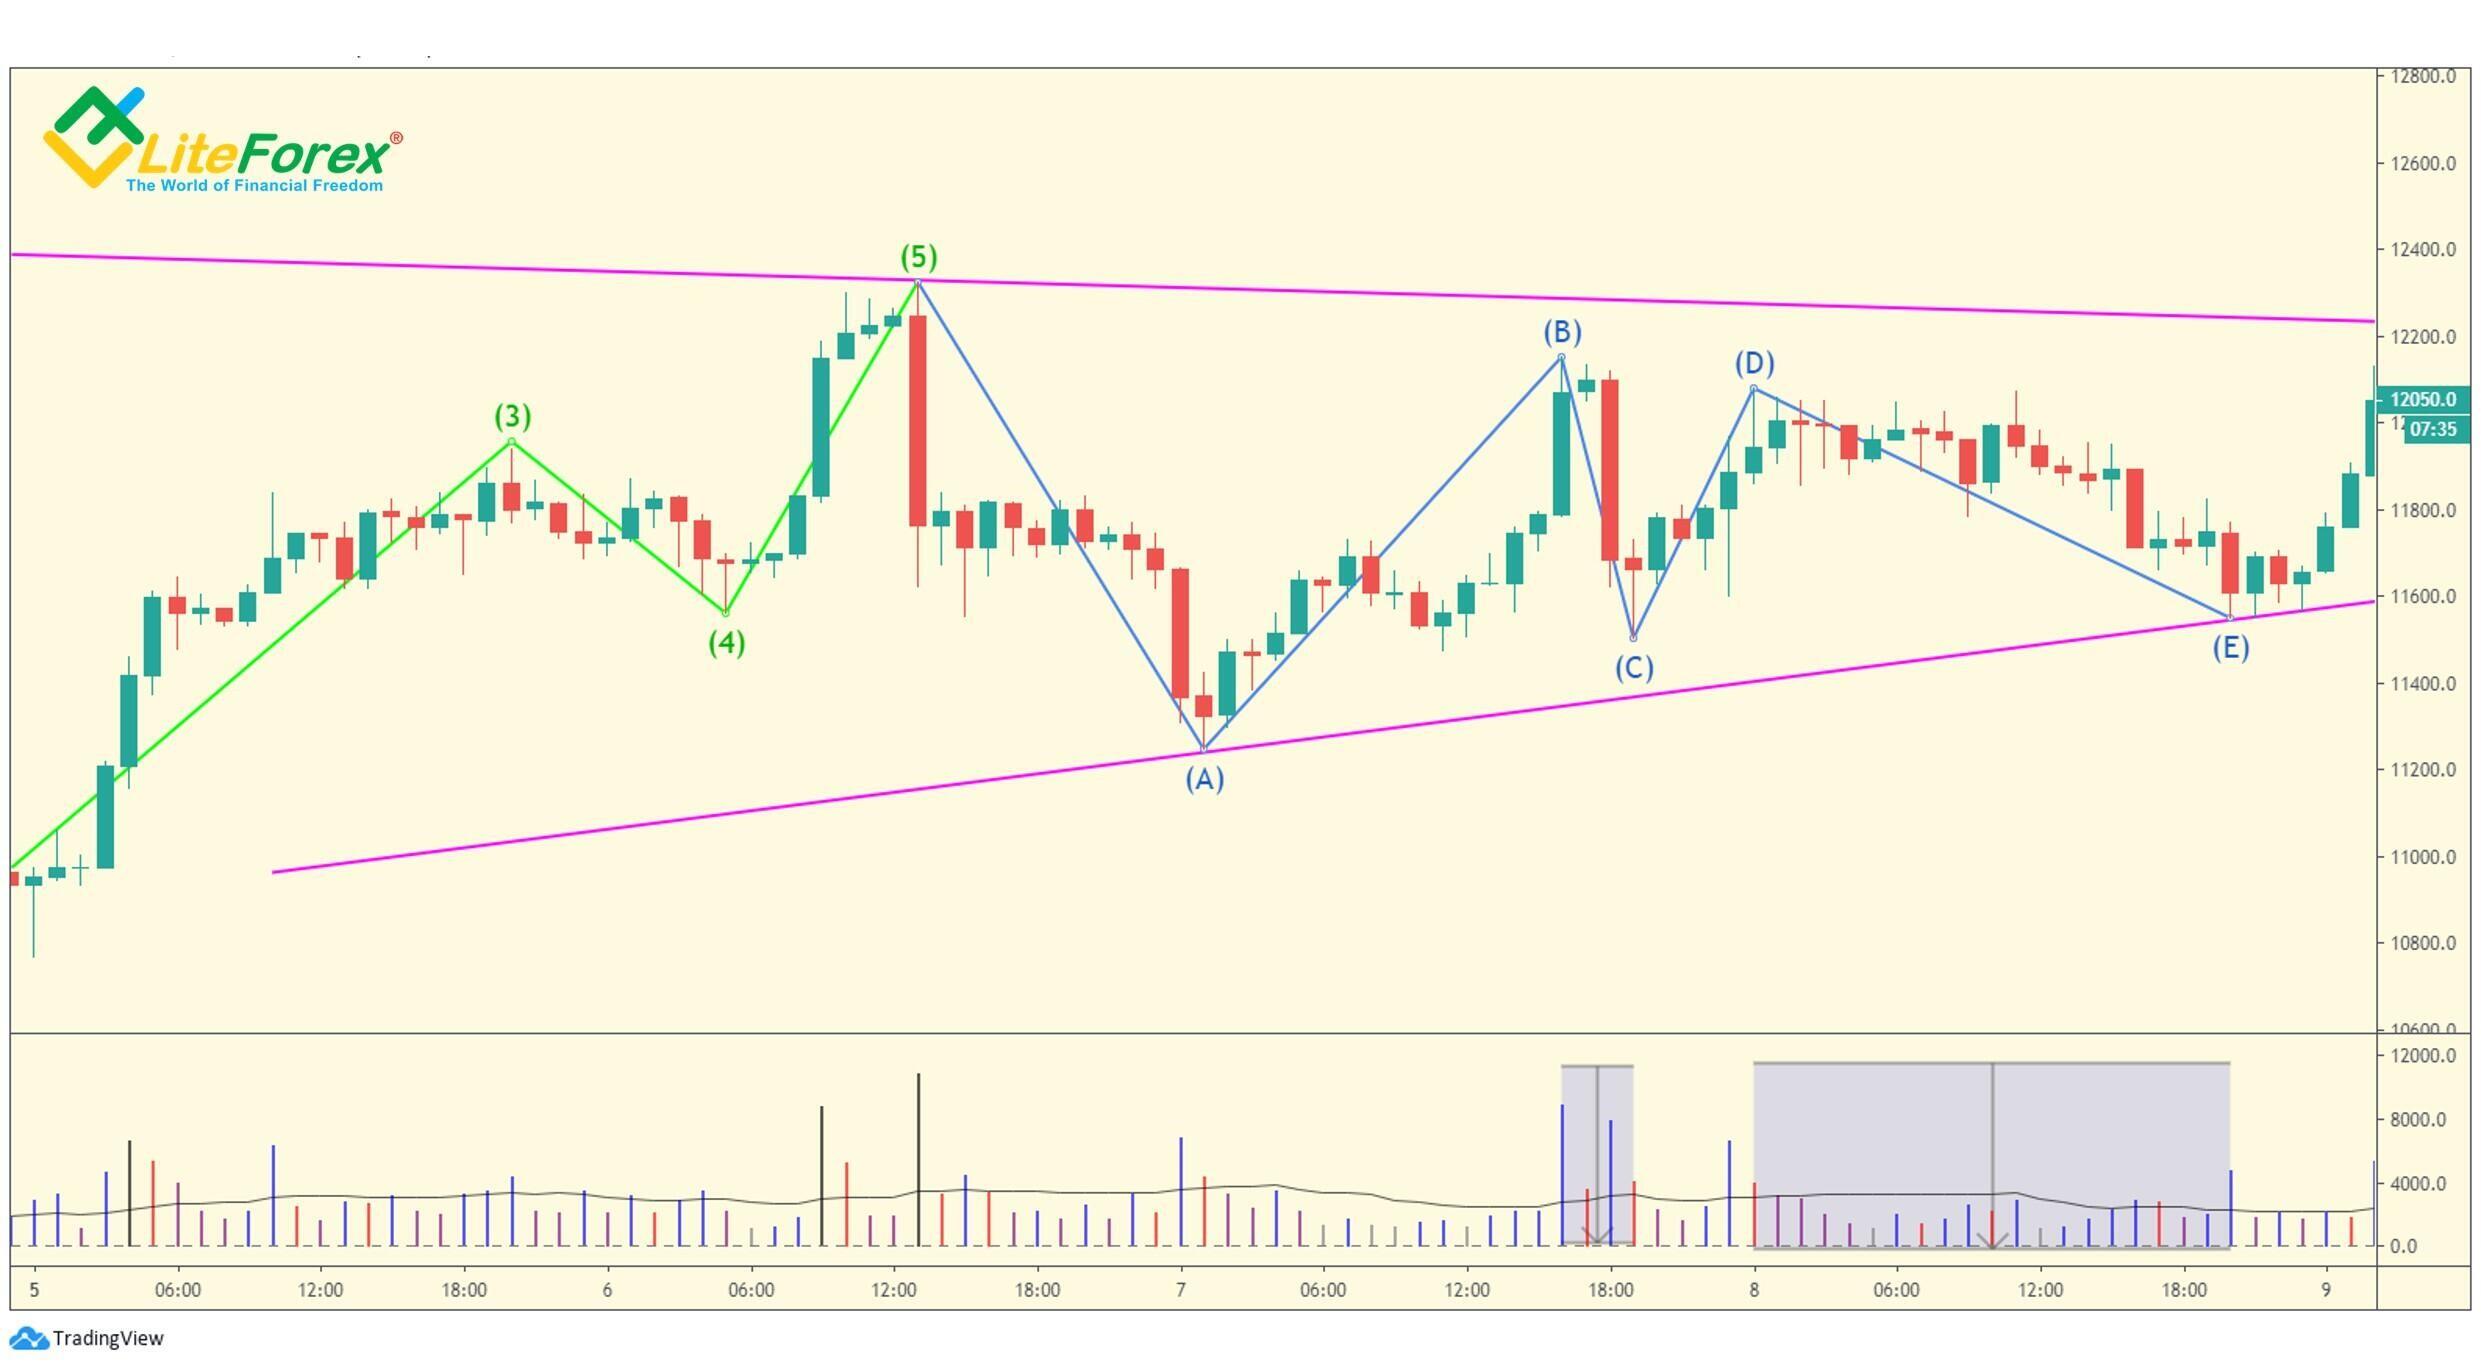
Like in the prior examples, blue zones in the chart mark the volume values corresponding to the wave C and E. Although, the third corrective wave is relatively short, the corresponding volume is greater than that of wave E. Furthermore, as wave E is getting closer to the triangle lower boundary, the volume also increases, which means that the traders who are bearish are getting into the market.
More guidelines on the Elliot Wave Principle
In his book A Capsule Summary of the Elliott Wave Principle, Robert Prechter gave more guidelines that will help traders eliminate errors in the process of the wave analyzing.
Scale
In one of the previous articles, I already mentioned that, at the large scales, it is better to measure the price changes in percentage terms, the same price swing will have different significance for different periods. Elliott notes that the larger the wave degree, the more necessary a semilog scale is. This an excellent idea, however, with some waves, if you change the scale, the accuracy of channeling decreases.
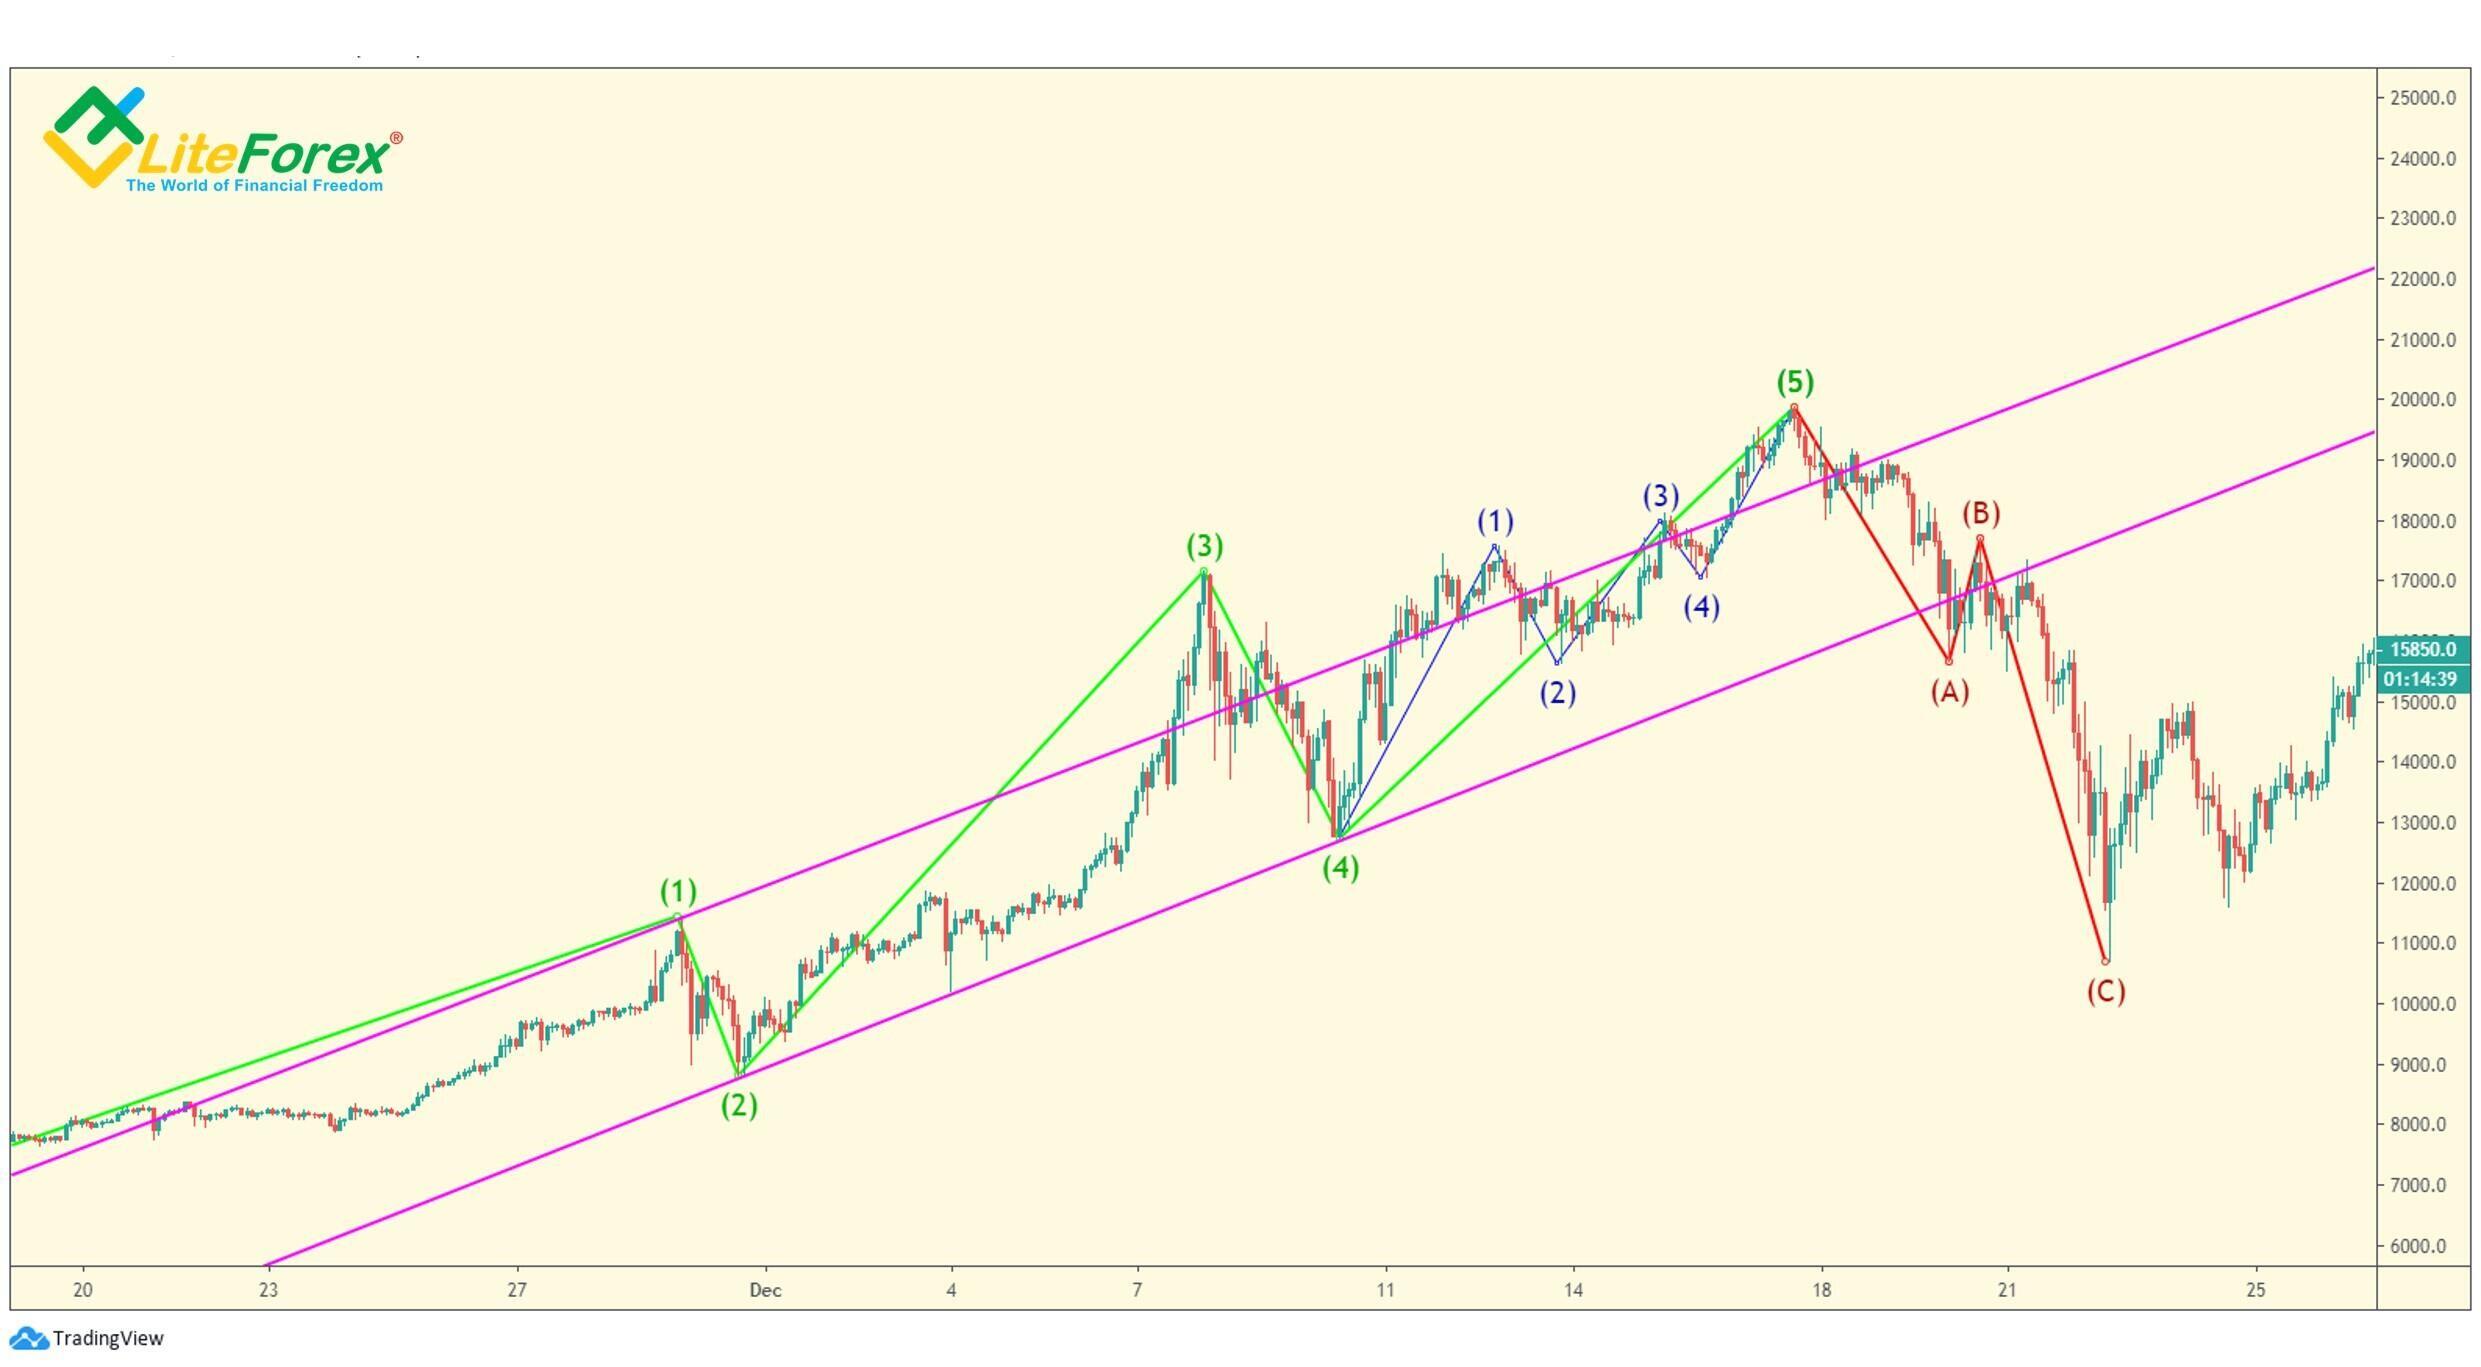
The figure presents one of the channels that we earlier analyzed on an arithmetic scale. Note that a sharp price swing in the fifth wave breaks through the upper boundary several times. After the first breakout, we can expect that the wave should finish outside the channel. In addition, the channel breakout is indirect evidence that the price could sharply drop after the fifth wave finishes.
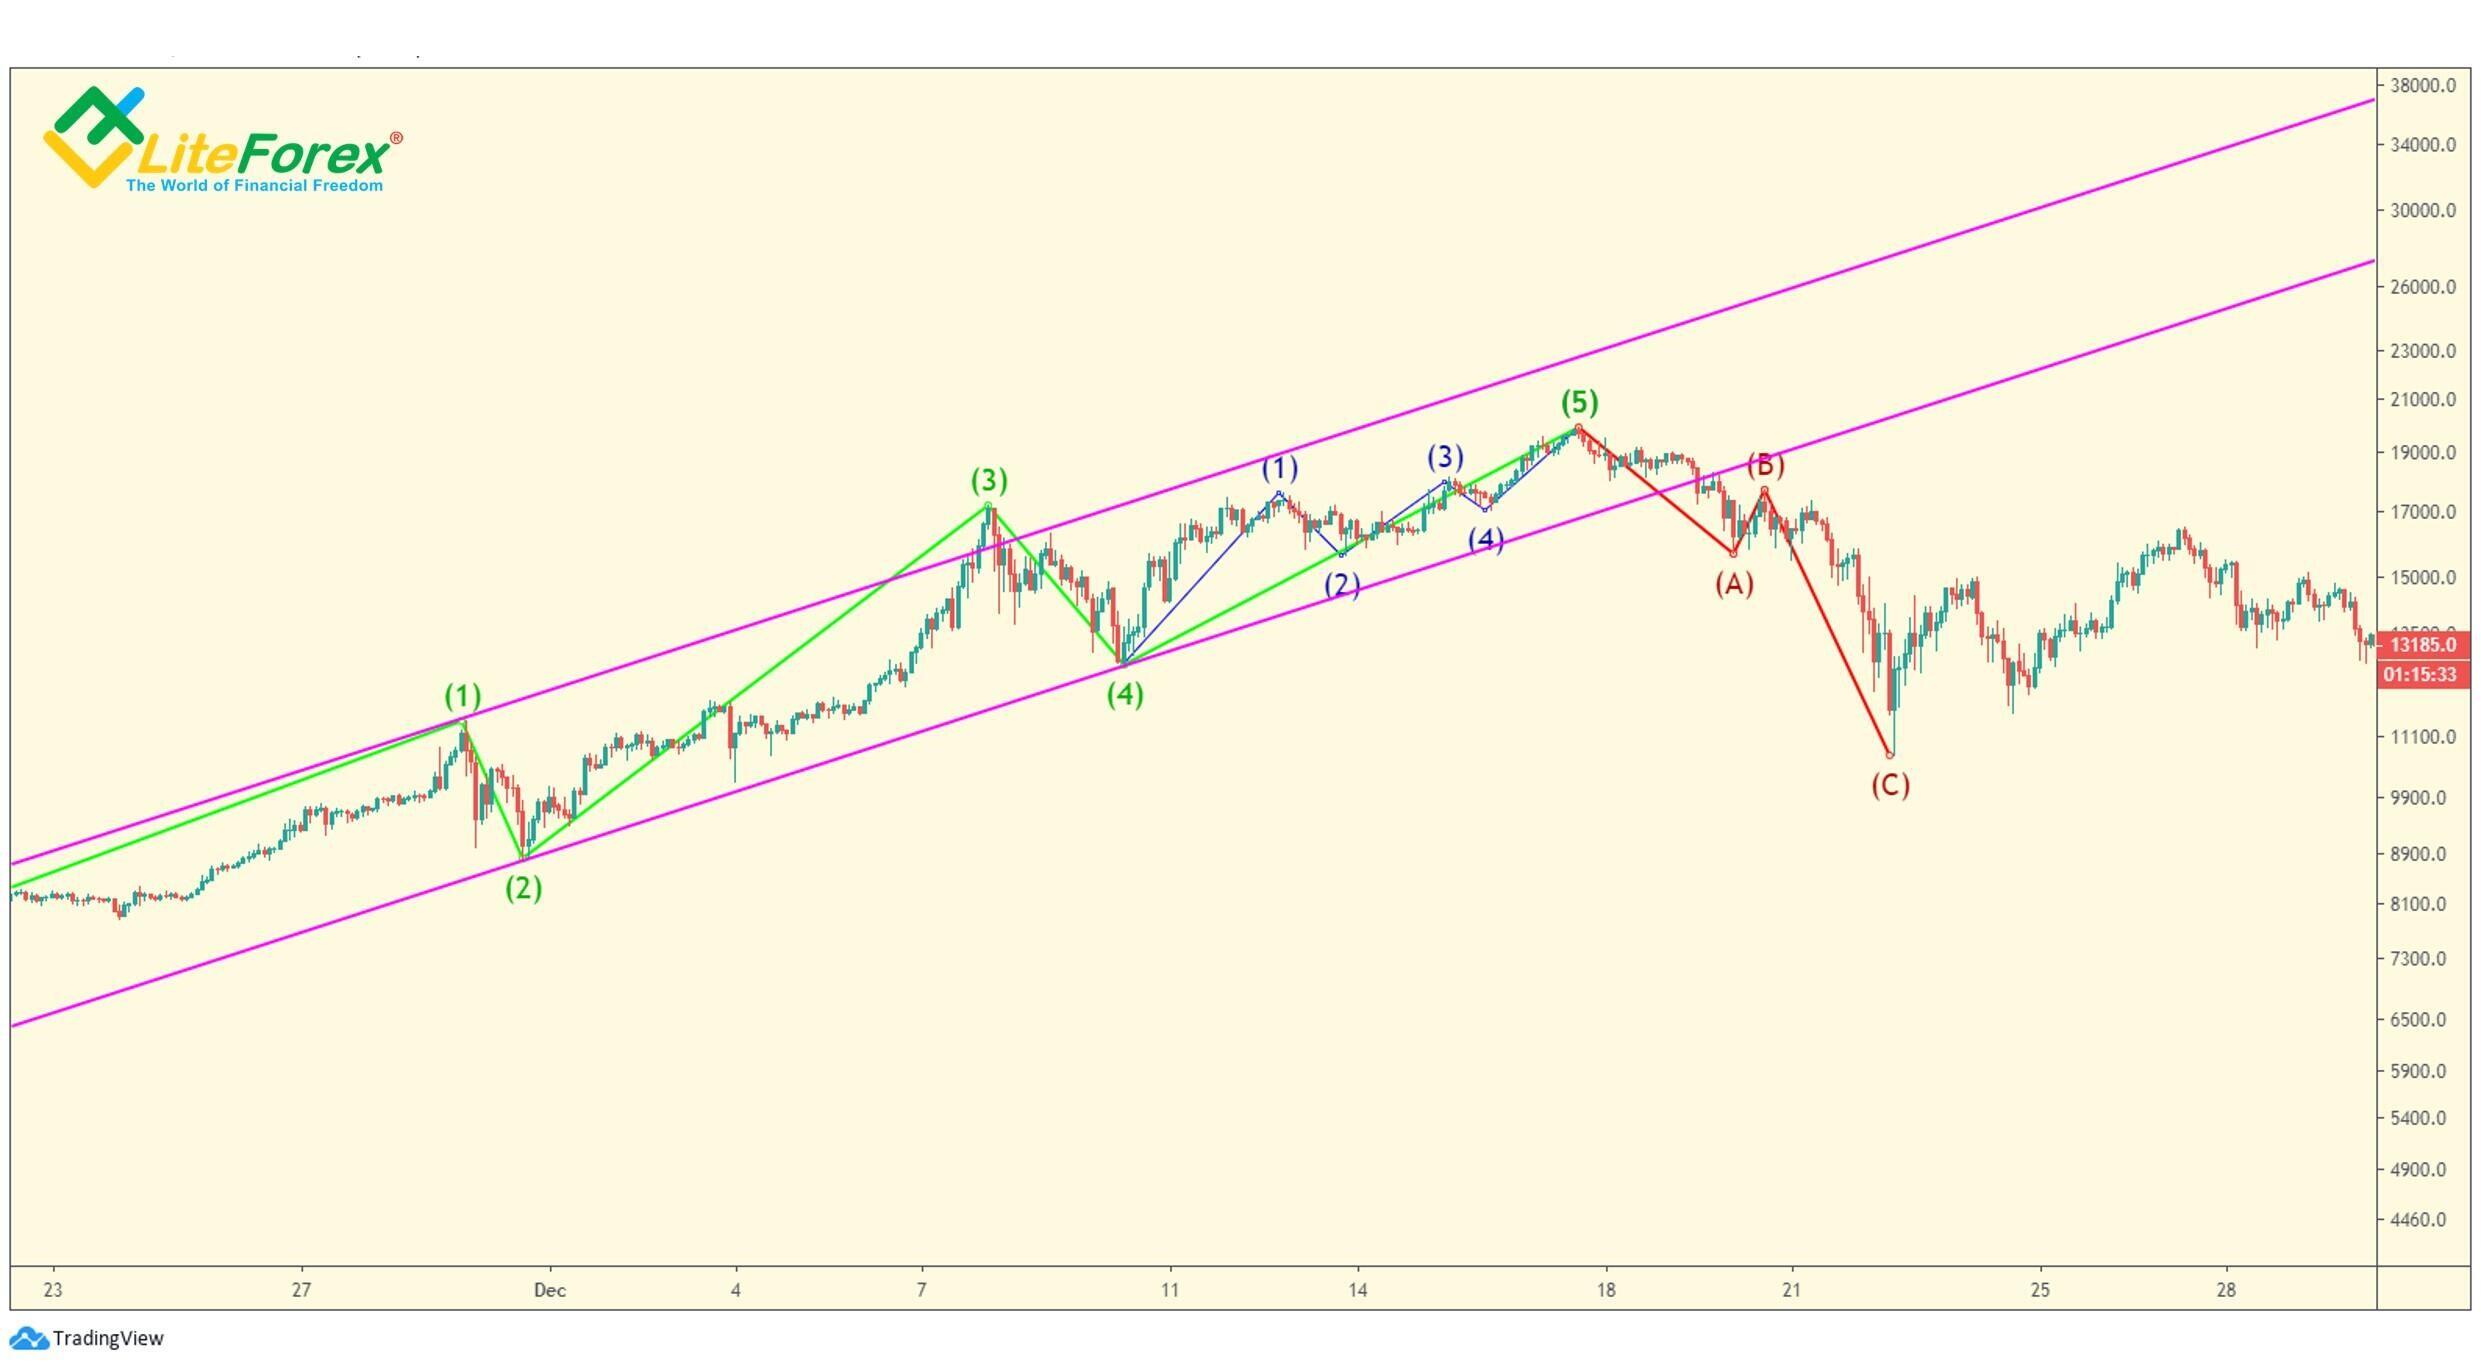
This is the same wave viewed on the semilog scale, where the price axis is calculated as a percentage, and the time axis is calculated arithmetically. As you see, the fifth wave here is far short of the upper boundary, and so, we couldn’t have predicted a sharp rise at the final phase of the wave development or the following pullback. Furthermore, the volume was high at the peaks of the five-wave sequence, which is indirect evidence of the market strength.
Prechter suggests that the need in the semilogo scale emerges in case of the analysis of a wave that is in the process of acceleration, for whatever mass psychological reasons. That is why it is better to use the semilogo scale at large degrees. In other cases, the arithmetic scale is more appropriate.
Besides, the best way out of any uncertainty is channeling in both scales. This way, you can choose the best charting technique providing the most detailed information.
Volume at different degrees
Ralph Elliott used volume to verify wave counts and project extensions. Those, who are familiar with my articles devoted to the VSA system, can use this guideline to identify the boundaries of waves, and also to see the turning points in advance.
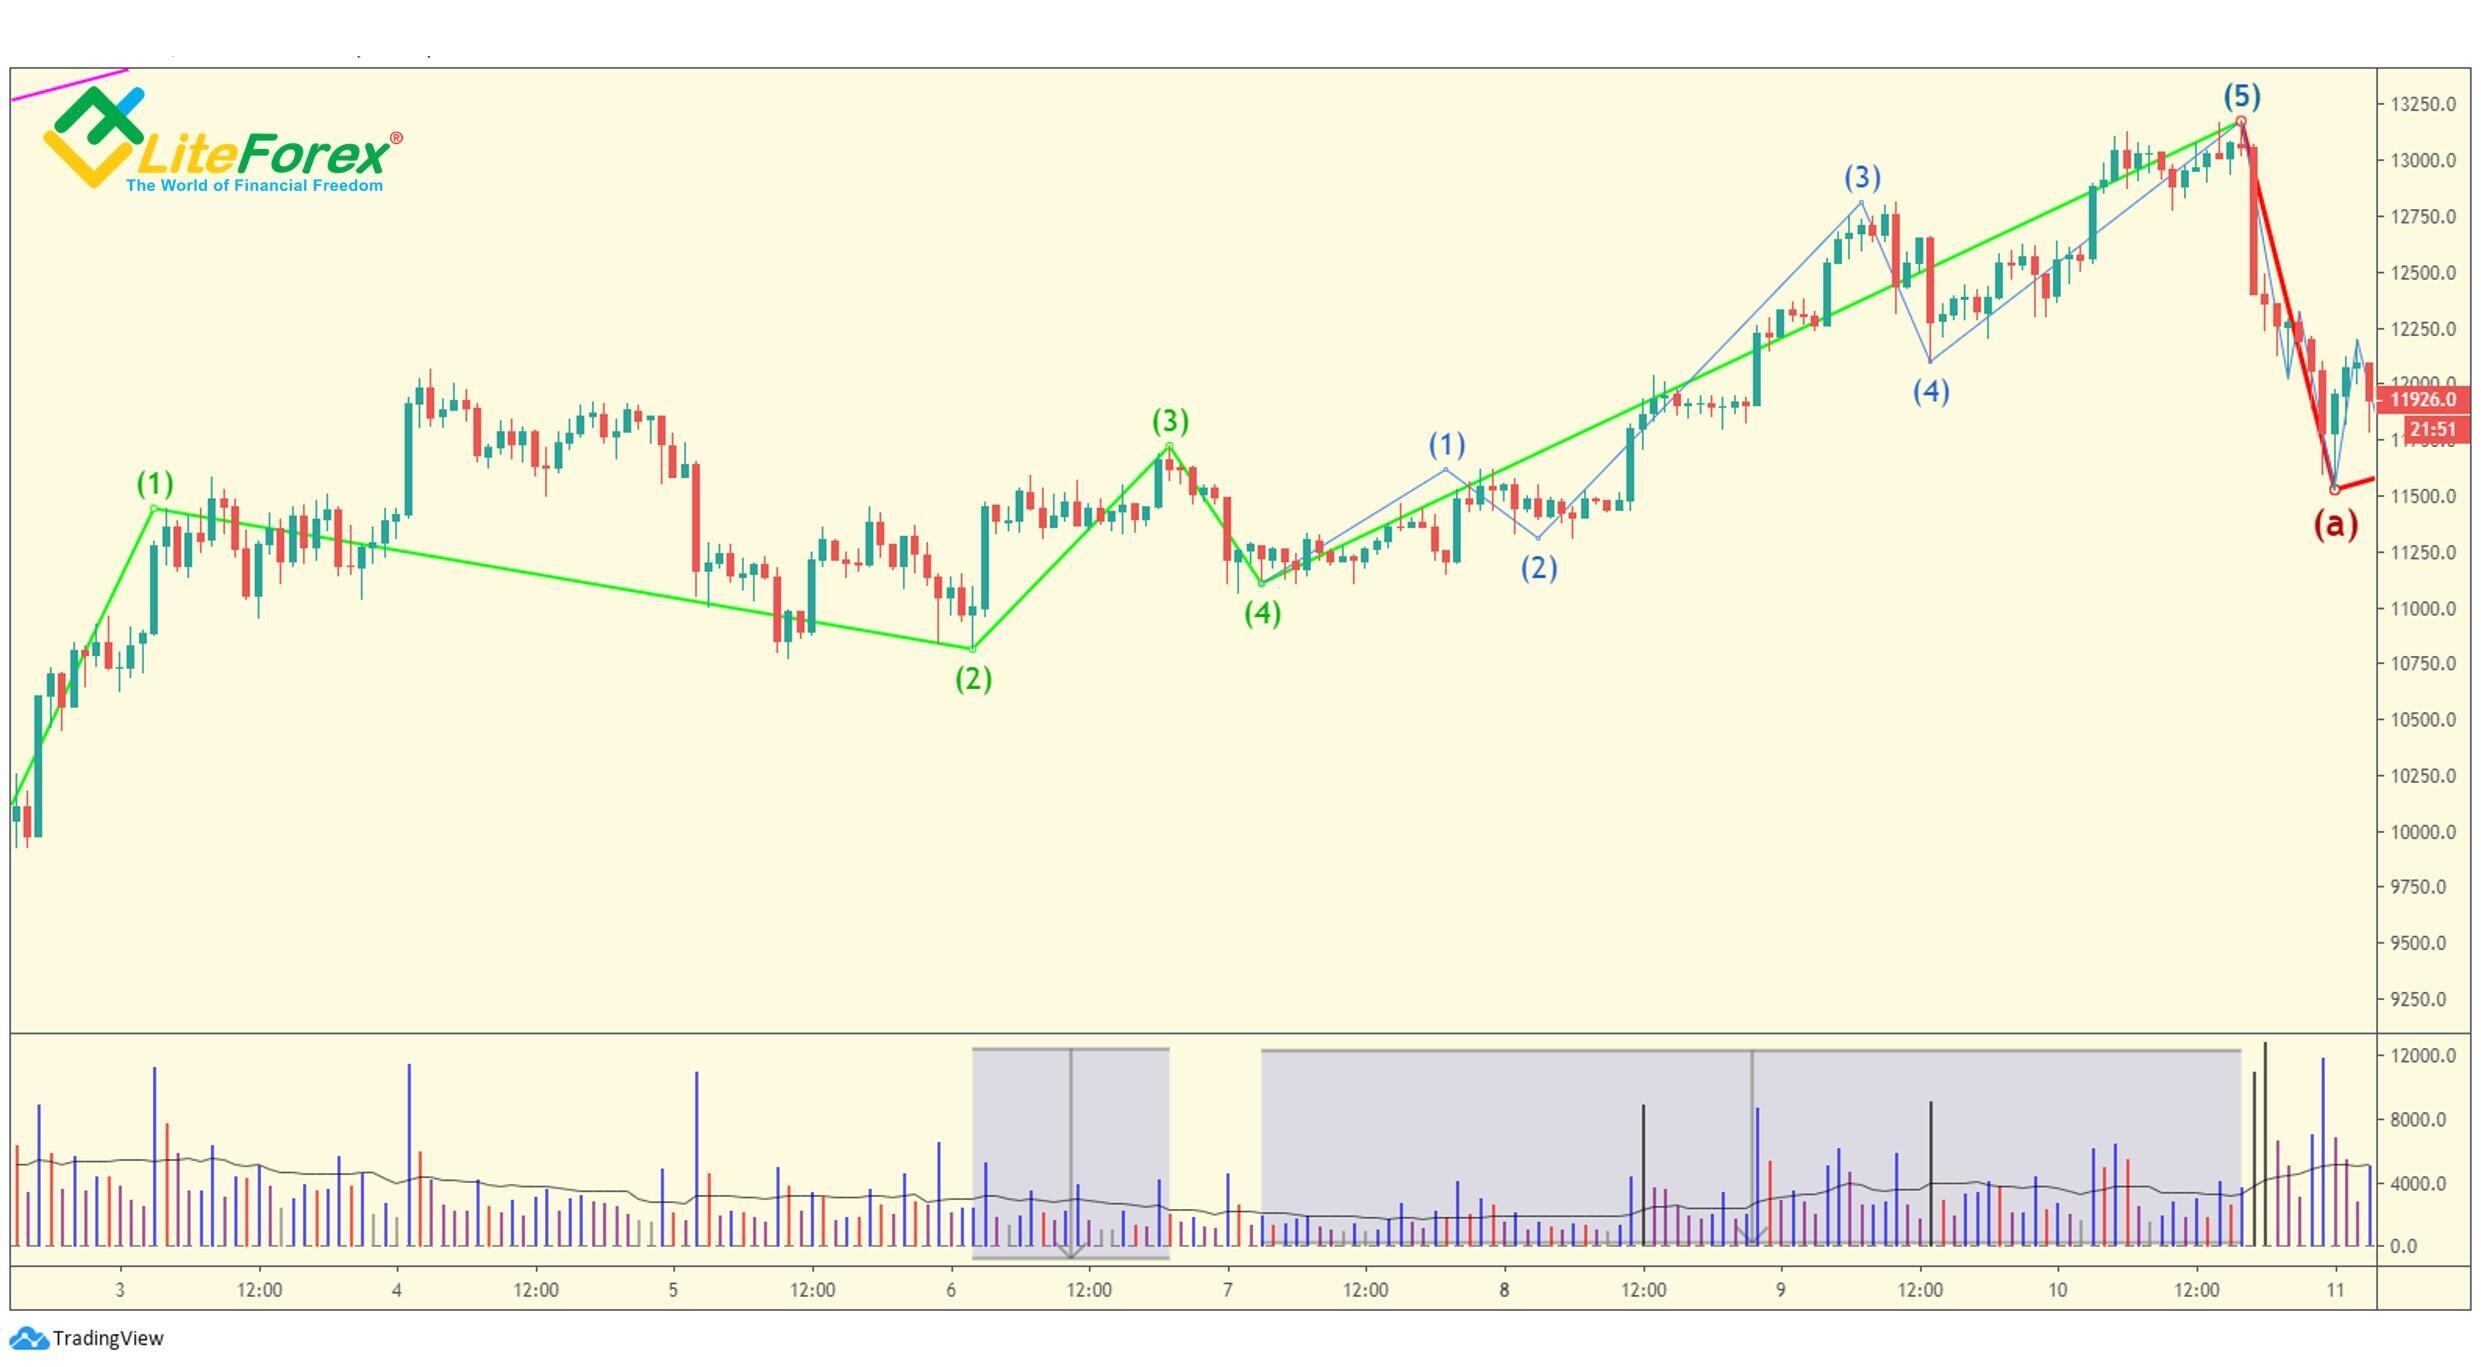
Elliott recognized that in any bull market pressure increases as the volume has a natural tendency to expand. The volume is especially high in the third wave. By this time, most traders are convinced in the bull trend and actively enter long trades. Similarly, in any bear market, bearish sentiment grows increasing the selling pressure pressing the price down. Late in a corrective phase, a decline in volume often indicates a decline in selling pressure. A low point in volume often coincides with a turning point in the market.
Red areas in the BTCUSD chart highlight the zones preceding the trend reversals. As you see, in all cases the volume declines compared to the areas where there was an intensive movement in the direction of the wave.
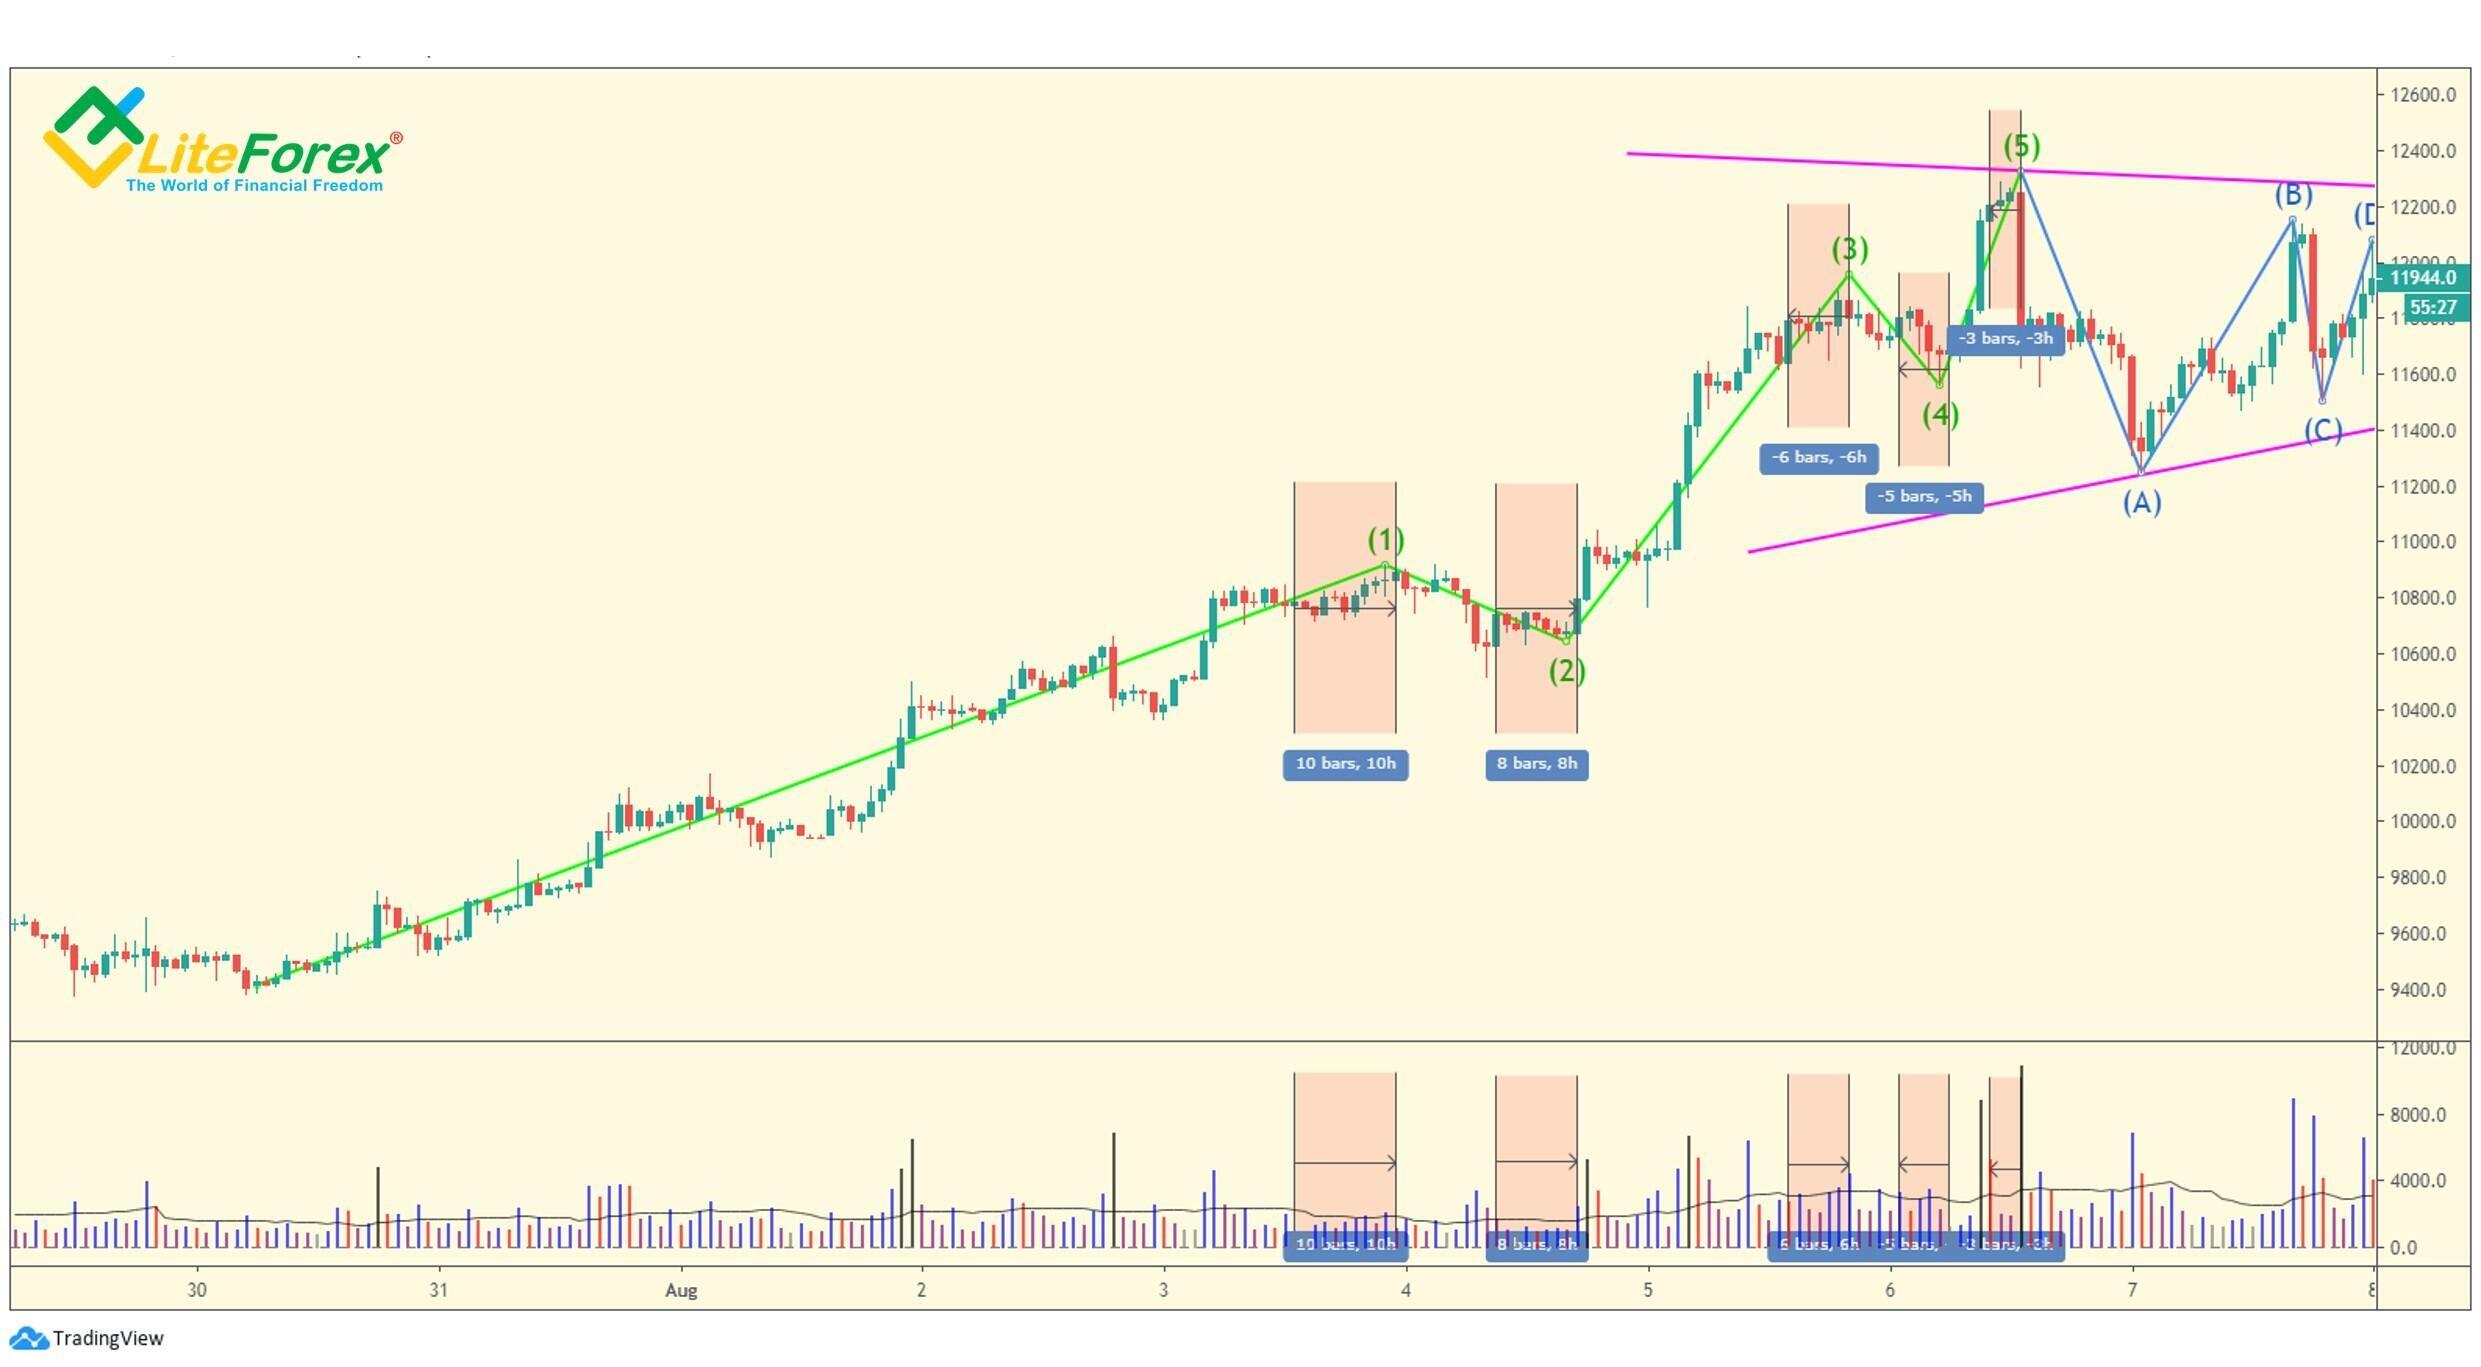
Elliott also recognized some regularities concerning fifths waves. I already wrote that in a normal fifth wave of less than Primary degree is less than in a third wave. If the volume is lower than that in the third wave, there is an extension of the fifth. This pattern will be especially helpful in those cases when both the third and fifth waves are extended.
The above BTCUSD price chart displays a normal third wave and an extended fifth wave. Blue areas on the indicator below mark the zones corresponding to the mentioned waves. The volume is average in the third wave, while the fifth wave, which is extended, is accompanied by a high volume. The highest value is in the third sub-wave of the fifth wave that is also extended and, according to the mass psychology, makes the majority of traders to enter long trades. Also note that, despite considerable excitement, the volume declines by the end of the fifth wave meaning that experienced traders are leaving the market.
At Primary degree and greater, volume tends to be higher in an advancing fifth wave. At the final point of the trend, the volume runs at an all-time high, as the long-term price rise results in the natural long term growth in the number of participants in bull markets. Most commonly, the volume spikes at the upper boundary of the channel at points of throw-over or the terminus of a diagonal triangle
That is all for today. In the next training article, I will introduce you to the wonderful world of fractal geometry. You will also learn how to apply the Fibonacci ratios, which I already mentioned a few times in the previous articles, to the wave analysis.
I wish you good luck and good profits!
No comments:
Post a Comment