Did Nifty make a bottom at 7,500? This is the biggest debate on the D-Street these days. If you look at history, which is often an indicator of what lies ahead, we may not be out of the woods just yet.
The rise in COVID-19 cases, as well as delay in economic recovery, could derail the recent rally for the bulls, suggest experts.
Usually, markets tend to move in a non-linear fashion during correction periods with false signals such as bull traps and in most cases forming double bottoms, according to data collated by a report from Prabhudas Lilladher.
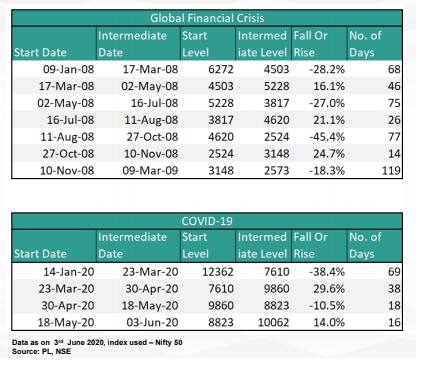
During the 2008 financial crisis, the Nifty 50 index saw three intermittent bull traps, first in March 2008, the second in July 2008, and then finally in October in the same year before finally bottoming out in March 2009.
In theory, a bull trap is a false signal which suggests that a recovery is underway, but the actual trend is still down. The move traps those traders who acted on the buy signal.
There were 3 bull traps during Global Financial Crisis where Nifty 50 rose by 16%, 21% and 25% from the intermediate lows hit in the 15-month period. The market finally bottomed out on March 9, 2009, and the bulls took over thereafter.

“Bottom formation is a long process requiring consolidation and within that, we could be seeing range-bound moves. Currently, we may be near the top end of the range. Hence, there is a fair chance that a fall may soon ensue,” Deepak Jasani, Head Retail Research, HDFC Securities told Moneycontrol.
“However, one point of difference between the previous crisis and the current one is that now we have a lot of cheap money sloshing around. Also, participants are confident that the central bankers may not allow macros to deteriorate and may take all actions necessary to avoid that from happening,” he said.
Central bankers across the world are doing the best they can to support growth in their respective countries to cushion the economic impact of COVID-19.
In a report last week, OECD said that it estimates India's GDP growth to contract between 3.7 percent and 7.3 percent depending on whether India undertakes another lockdown.
Experts feel that the economic impact of COVID-19 will remain for a year, and the earnings will take a hit which is something that is discounted in the market at current levels. Any more bad news could well derail the party for the bulls.
“There has being a slowdown in the economy due to the lockdown in various parts of the world and domestic economy too will hit and GDP and earnings growth will remain tepid for the current year,” Vikas Jain, Senior Research Analyst at Reliance Securities told Moneycontrol.
“As the lockdown opens up, demand will increase and earnings will start improving so we could have an improvement in broader markets. There could be intermediate swings after this sharp up move in a very short time but Nifty has good support in a range of 8,800-9,100 levels on multiple time frames and retracements,” he said.
Jain further added that the bottoms are in place at current levels unless there is some fresh negative news flow in the domestic or global markets apart from the COVID-19 crisis.
What do the technicals say?
Historically, we have seen that after every 3-4 years of bull-run, the market corrects for a few months before resuming its uptrend.
Currently, the index is making a series of higher highs and higher lows on the daily chart, indicating that the short-term bullish trend is still intact.
The first rule of the market is - never go against the trend. As of now, Nifty is trading above its 50-DMA which indicates that the short-term trend is bullish. But, there are key resistance areas on the upside.
“On the higher side, 10,550 which is 61.80 percent Fibonacci retracement of recent fall is an important level to watch for, if markets manages to cross above 10,550 levels then there would be fewer chances to break the previous low which we have formed in March,” Rajesh Palviya, Head - Technical and Derivative Research, Axis Securities told Moneycontrol.
“If we take reference for historical data and the trend pattern of the market for 2008-2009, then it has to violate the 8,800 (which was 3,817 as per historical chart) levels to turn bearish,” he said.
Palviya further added that below 8,800 is when we can conclude that the Bulls are trapped and bears may have finally entered and we may follow the same trend of 2008-2009.
The rise in COVID cases could result in selling
The impact of rise in COVID-19 cases was already felt last week when reports of the second wave of coronavirus cases in the US derailed the rally.
If the second wave does come then this could take the market to new lows.
“While there is a chance that the current rally could be a bull trap, the possibility of a capitulation happening in the markets from here on is relatively lower. Government and central banks globally have acted very proactively and prevented the situation from deteriorating significantly unlike the global financial crisis wherein there was government action only after the collapse of Lehman Brothers,” Jyoti Roy, DVP Equity Strategist, Angel Broking Ltd told Moneycontrol.
No comments:
Post a Comment